
Guide: how to choose a supplier engagement tool
Reliable data, suppliers who answer, and a programme that scales.
Read article
Supplier engagement
Every product in your range has a footprint on day one. Invite the suppliers behind it, tier by tier, and the footprints update as their data lands. Free for every supplier.
Purchased goods and inbound transport are 90 to 97 percent of a retailer's or wholesaler's footprint, in the inventories we run.
Here, suppliers enter data into your model, not a spreadsheet you have to translate.
One model for benchmark and supplier figures. The difference is real, or it is not there.
Requests travel to the tier that holds the data, and the answer travels back.
How a programme runs
Every product in the category is calculated before a single supplier is invited, so every supplier arrives to their product, already there.
A full range in weeks. Then the invitations.
Start with the suppliers that matter most. Requests and reminders go out automatically, and each supplier can pass the request on to their own suppliers.
Staged communication, in the supplier’s language.
Set a target with each supplier and follow it where they report. Your portfolio view adds up progress toward your own target.
Packaging attributes under PPWR travel in the same request.
Packaging and PPWRYour product is already here, with a benchmark figure. Enter your own data and the figure becomes yours. It is free, and your customer sees the result, never the recipe.
Their own account and data. Results travel to you; the recipe never does.
Their data sits next to the same benchmark as everyone else’s, so a real improvement shows.
The footprint they enter for you answers the next customer who asks.
They can invite upstream in turn, so tiers open without you writing an email.
What you see
Across the range: the Primary Data Share by category, supplier and product, and the Data Quality Index.
On every movement: the Change Log, separating supplier reductions from data improvements.
By origin: every link declared by the party that holds it, so land emissions are reported by commodity and origin.
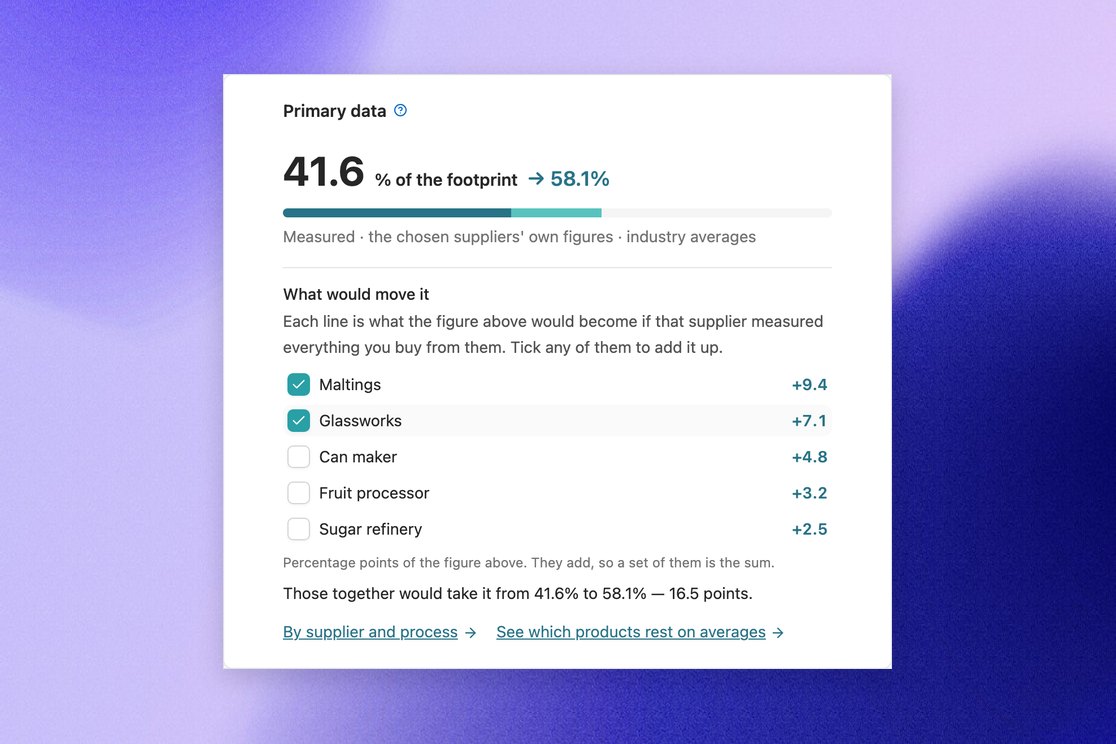
The share of purchased volume resting on supplier primary data, with last year's beside it.
Per category, as the GHG Protocol asks.Supplier reductions on the record, separated from data improvements.
Product by product, in the Change Log.Then coordinate
Hotspots by supplier and ingredient, scenarios priced with your internal carbon price, and shared plans with the suppliers who hold the lever.
Customer proof
How Bidfood brought its suppliers in: read the story
Reliable data, suppliers who answer, and a programme that scales.
Read article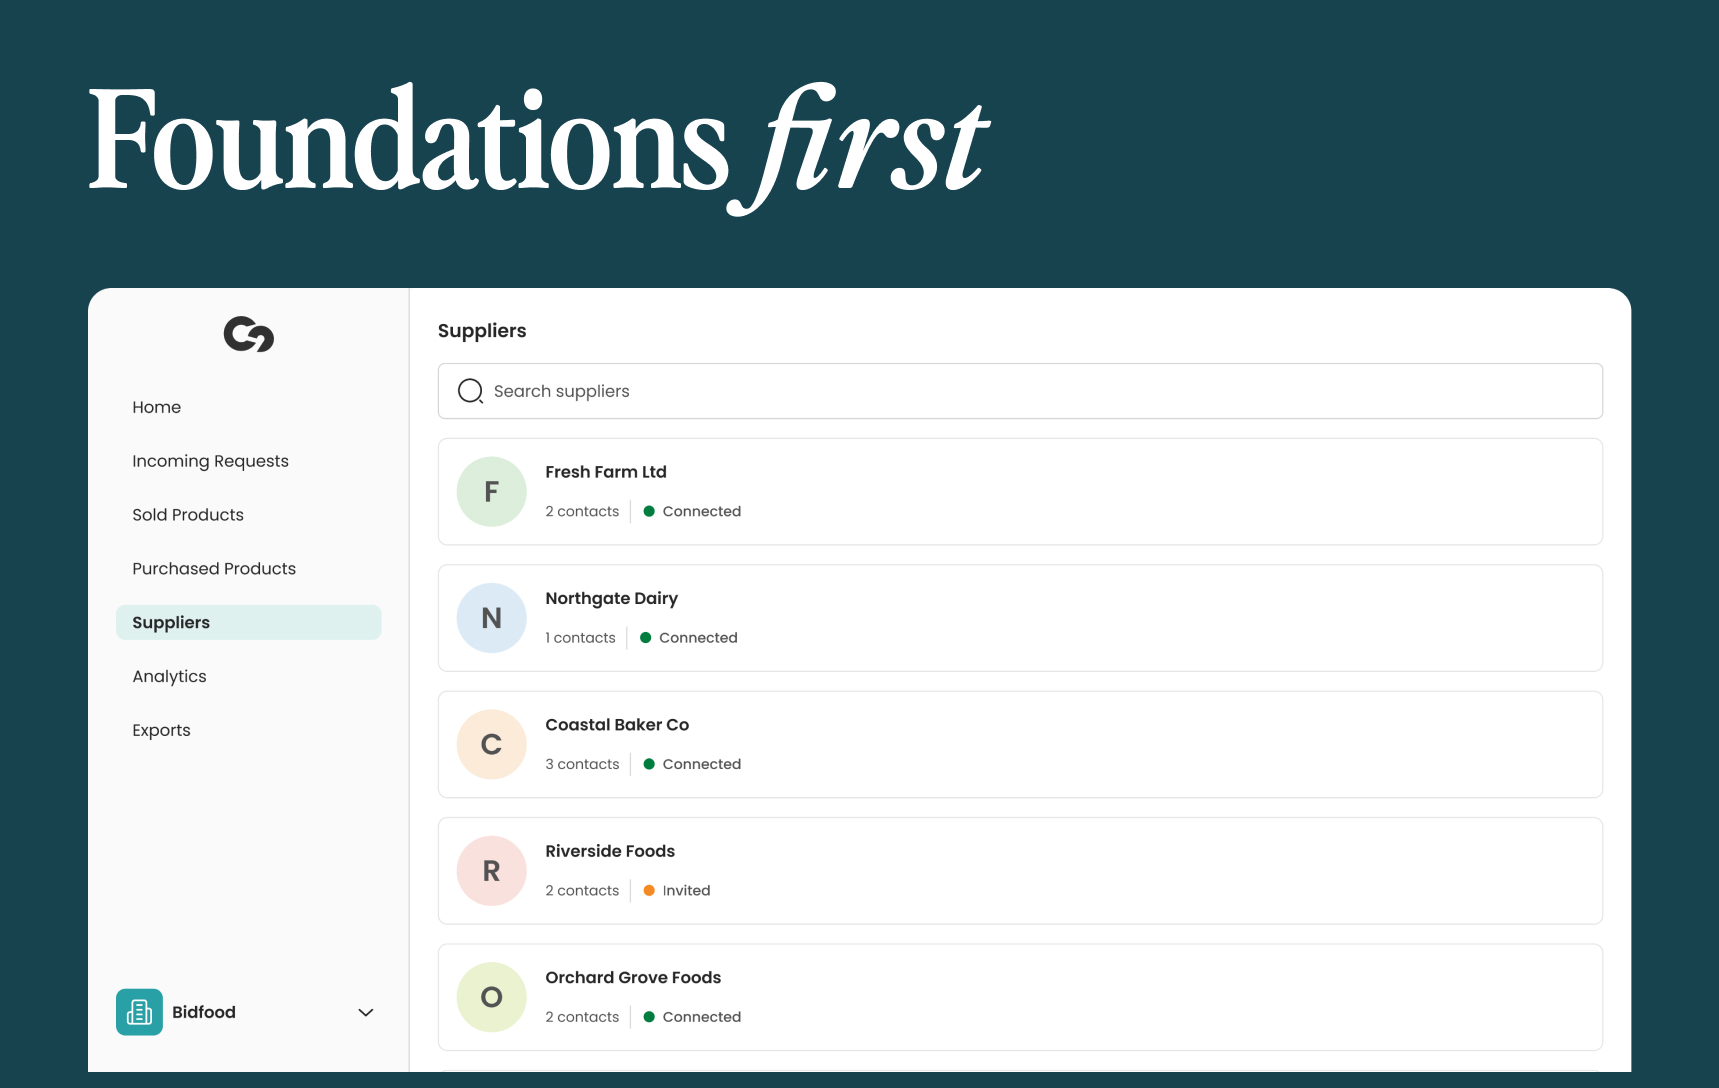
Range modelled first, suppliers invited in waves, more than half of the first group connected within two weeks.
Read article
The roadblocks to primary data are real and solvable.
Read articleRequest a demo
Pick one category. Every product in it has a footprint on day one; the invitations go out from there.