CLIMATE SOLUTIONS FOR INGREDIENT PRODUCERS
Give food producers an extra reason to choose you: Climate performance
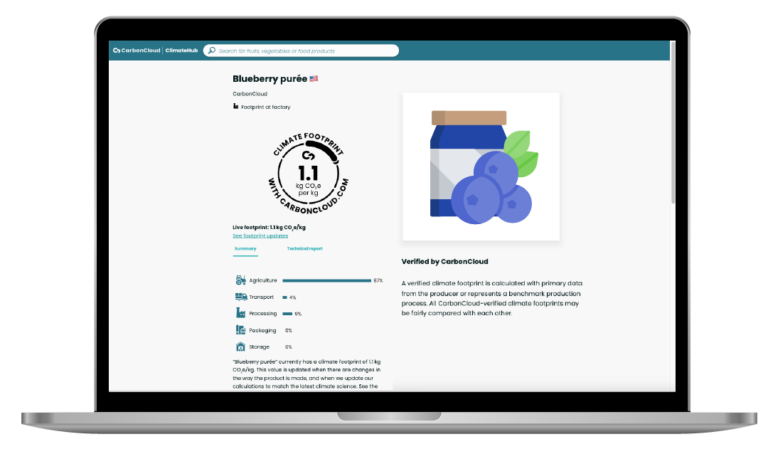
When everything else is on par, your climate footprint can be the number that makes you stand out. Make your products more attractive to food brands and producers by giving them the holy grail of food system emissions: Comparable climate footprints of their ingredients.
STAND OUT AMONGST YOUR COMPETITION
Top-performing ingredients?
👉 Climate-champion products
CALCULATE
Share accurate climate footprints in weeks
No one knows the ins and outs of your product better than you. Use the data you have to get high-definition climate footprints of your products in just a few weeks with Automated Modeling.
Your climate footprints are always:
- Substantiated
- Verified
- Auditable
- Comparable
- Up-to-date
- Instantly and automatically shareable with vendors.
Your production processes and recipes stay with you.
Is the Automated Modeling engine credible?
CarbonCloud is a combination of a climate calculator (LCA tool), a supply chain management system, and a database. Every product assessed and published on the platform is available on the platform as an ingredient for other production processes. Everything with market-leading consistency and detail.
At the foundation is the agricultural engine (based on 2019 IPCC guidelines) that calculates the climate performance for agricultural products at farm gate. It comes pre-populated with production system data for close to every commercially grown crop from every country in the world where it is grown. They are all consistently calculated based on the best available data for yields, fertilization, soil types, climate zones, etc.
On top of this, there are thousands of modules for refinement processes and semi-refined products, fuel types, country-specific electricity, and a vast dataset of benchmark products at store shelf.
The data counts in the tens of thousands and is rapidly growing, as CarbonCloud continuously develop the dataset and increase its resolution, and via increasing numbers of farmers, B2B producers and B2c producers joining the platform. All this data is available for users of the platform and a large share of the data is openly available at ClimateHub.
Each footprint is based on input data from high-quality sources. The data available on the CarbonCloud platform mainly derives from three origins:
- Statistics and data from national and international agencies for example the Food and Agriculture Organization of United Nations or the National Inventory of Submissions of the UNFCCC.
- Relevant scientific literature: if the process ingredients are modeled, we utilize extensive scientific literature which our in-house science team reviews and adapts accordingly.
- User input: the platform learns as users feed production system data into it.
Our calculations and methodology are compatible with ISO 14067 and GHG protocol Product Life Cycle Accounting and Reporting Standard, which are the current standards for LCA studies.
What data do you require to get started with Automated Modeling?
As a starting point to do the initial mapping of your product portfolio, we would ask for the following information on your products:
– Product name
– Bill of Material
– Production location, at least country
– Market where the products are sold
– Packaging material(s)
There is a long list of information that will increase resolution and accuracy, but a relatively short list will do most of the work.
CarbonCloud never asks for GHG emissions for any process. For consistency, all emissions are calculated by the platform. All questions relate to production processes with a focus on readily available information to the producers and suppliers. You don’t need to dive deep into the science or methodology to get the climate footprints of your portfolio. You instantly get the richness of immediate insights while feeding in the data and working on the platform. Everyone quickly becomes a climate expert on their part of the business.
What happens after my company provides the data?
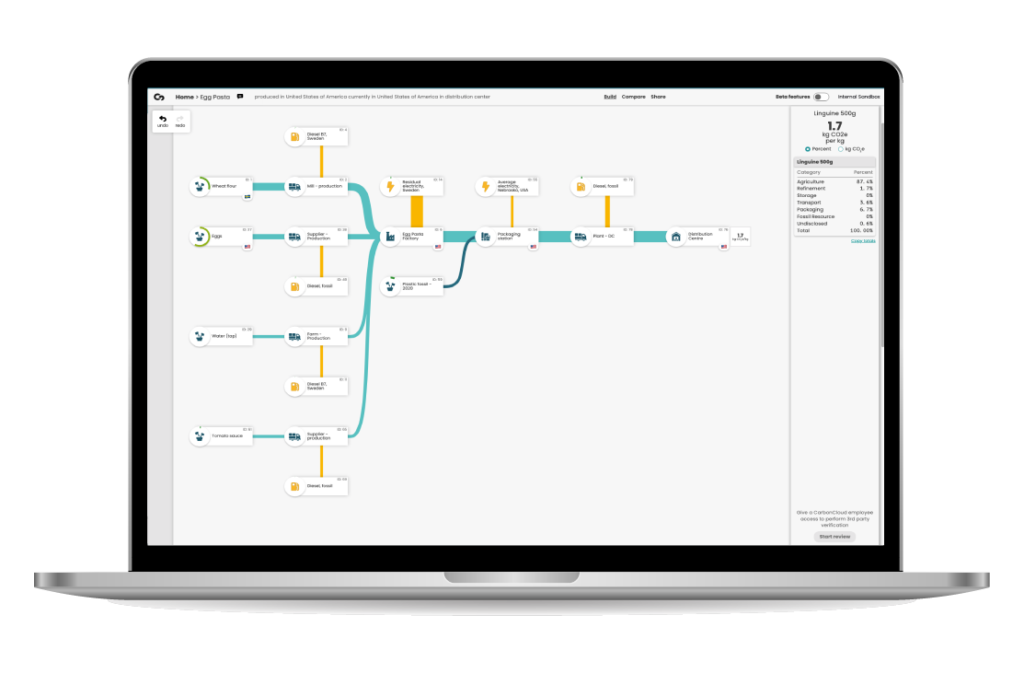
CarbonCloud runs your data through a machine learning algorithm, together with the platform’s library of ingredients, production processes, transport modules, etc., to map out representative supply chains for every ingredient and product. At this stage, your company gets complete and consistent scope 1+2+3 mapping for your portfolio, accompanied by a breakdown per product and per stage in the value chain.
Granularity and precision depend on the amount of information available at the time of the mapping. The insights from Automated mapping will guide the users of the platform as to how best to proceed: Which additional data to collect to increase resolution where it matters the most, which products to focus efforts on, and which suppliers to engage for the highest ROI relating to actionable insights and data.
COMMUNICATE
Stand out amongst your competition
Prove your competitive advantage
Food producers are looking for fuss-free ways to reduce and report the emissions of their products. Present your data-backed climate advantage, help your buyers shine, and reach their targets.
Help new buyers find you.
Share your footprint on ClimateHub and in CarbonCloud’s database and make it easier for buyers to choose you when they search and compare for best-in-class climate performance.
We offer emissions savings as a painless switch – it’s easy and cheap. For food companies it is important for their reporting. We offer them reliable figures for their footprint calculations and savings and referring to the CarbonCloud assessment helps a lot with the discussions with customers.

Dr. Sara Marquart
CTO and Co-Founder of Planet A FoodsPlanet A Foods sells 92% CO2e savings
...and the food industry is buying
Planet A Food’s main product is CO2 savings. Their flagship product, Nocoa, is taking over the confectionery world with the support of demonstratable, evidence-based 92% emissions savings.
CONNECT & COLLABORATE
Join the climate network and become the easy choice
Take your place where food producers are modeling and optimizing their supply chain emissions. Calculate the climate footprints of your products in CarbonCloud and share the metric that matters instantly and automatically with new and existing buyers.
Let the digital network do the distribution for you. You stand out as the best-in-class supplier and enabler, your buyers stand out with primary data throughout their supply chain.
We want to be able to see our suppliers and our complete chain. They are also developing with new ways of production or lowering their footprint. Having that information really shows you where your climate footprint is coming from.

Mieke van Vugt
Marketing manager, Cérélia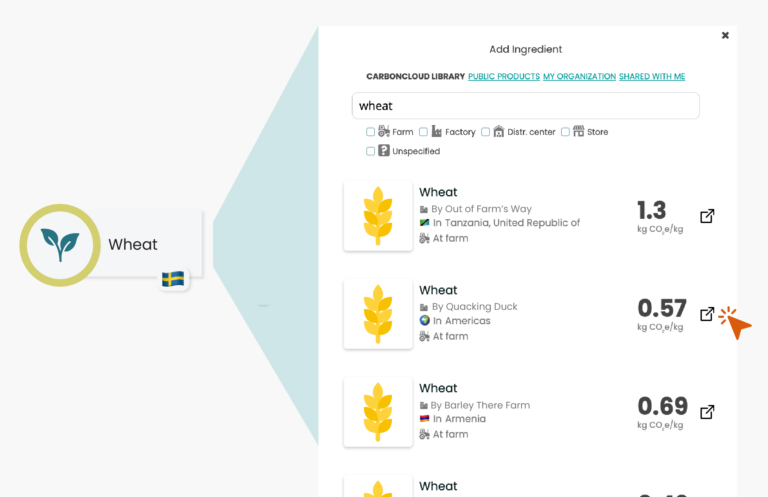
REDUCE
Manage and work with the climate footprint of your product
...And while you're at it →
You may want your suppliers to do for you what you are doing for your buyers! Invite your suppliers onboard, increase data definition throughout your supply chain, and work together to reduce emissions.
CLIENT STORY
Cérélia, one recipe switch and a 30% reduced climate footprint later...
Mieke and her team are taking climate footprint reductions seriously. Since they started working with CarbonCloud, the OaYeah! pancakes can now boast a 30% lower climate footprint – a result of motivation, dedicated work, and actionable climate data and insights.
REPORT
Claims that withstand any stress-test
Share up-to-date, robust, auditable emissions metrics with producers, voluntary disclosures, and target-setting entities.
Seamlessly respond to your buyers’ call for Scope 3 data and even pass the baton of climate data collection in your supply chain.
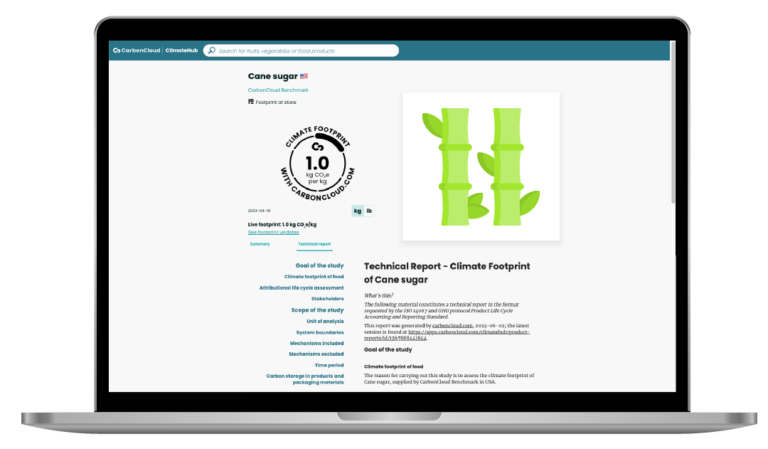
A standard-conforming technical report for every product is always at arm’s length, substantiating your calculations without disclosing sensitive trade secrets.
A single robust number for all stakeholders:
TCFD Emissions metrics
Emissions metrics for Section 4 of CDP, Mandatory climate-related financial disclosures and all TCFD formats
SBTi
FLAG & Non-FLAG emissions separation for SBTi calculation. Base year calculation for SBTi (including FLAG) and consistent historical performance data for committed targets.
GHG Protocol
The technical reports are in the format requested by GHG Protocol Product Life Cycle Accounting and Reporting Standard and applicable to Purchased Goods and Services for retailers reporting for the GHG Protocol Value Chain Standard.
PEF
Cradle-to-gate GHG emissions metrics in impact category climate change for PEF.
HOW TO GET STARTED
From decision to campaign in weeks
It doesn't take months to get your hands on your emissions map – really. Let computers do the calculations and focus on making your products climate-smart and letting the world know
You: Input the data you work with on a daily
Simply list the portfolio data you already know by heart – product name, ingredients, country of origin, GTIN number.
CarbonCloud: Automated emissions modeling
Automated Modeling, our emissions modeling engine, scans your input, programmatically matches each product to its supply chain model, and calculates the climate footprint
You: Share your climate footprint with the network
Share your emissions metrics CarbonCloud's digital network, increase the data definition of your existing buyers automatically and stand out as a climate champion among new buyers.
Ready when you are!
Ready to make climate performance a competitive advantage?
Stand out with your climate footprint as the best-in-class ingredient provider. Reach out to our climate performance experts to see how you can jumpstart your emissions metrics calculations and share results with the food industry.