
Your climate data, where your decisions happen
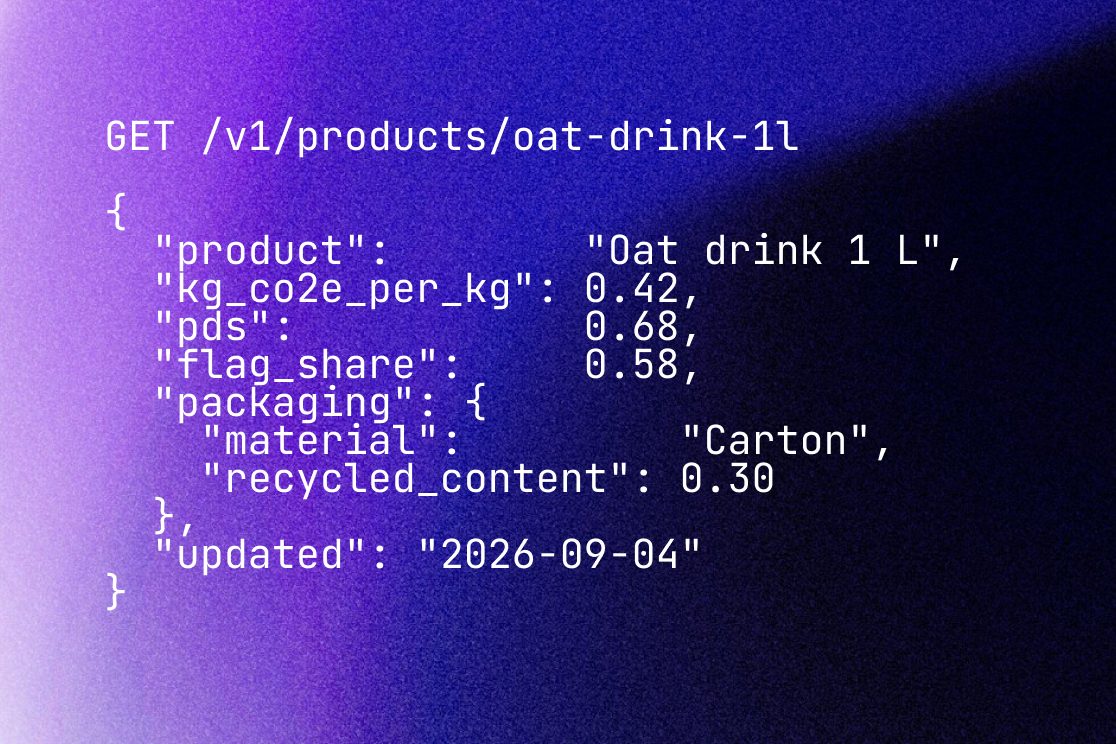
Live footprints, Primary Data Share and packaging attributes delivered into ERP, PLM, BI and the digital shelf. And the CarbonCloud database, for building services of your own.
Contact usData as a service
Your portfolio, delivered as a live feed
Everything the platform knows about your products travels to where the decisions are made: footprints and Primary Data Share into your ERP and BI, packaging attributes into your PLM and spec systems, carbon labels onto your digital shelf.
The feed stays current on its own. When a supplier reports, the numbers in your systems update, so procurement, category management and reporting always work from the same live figures as the platform.
Our data
Or build on our extensive database
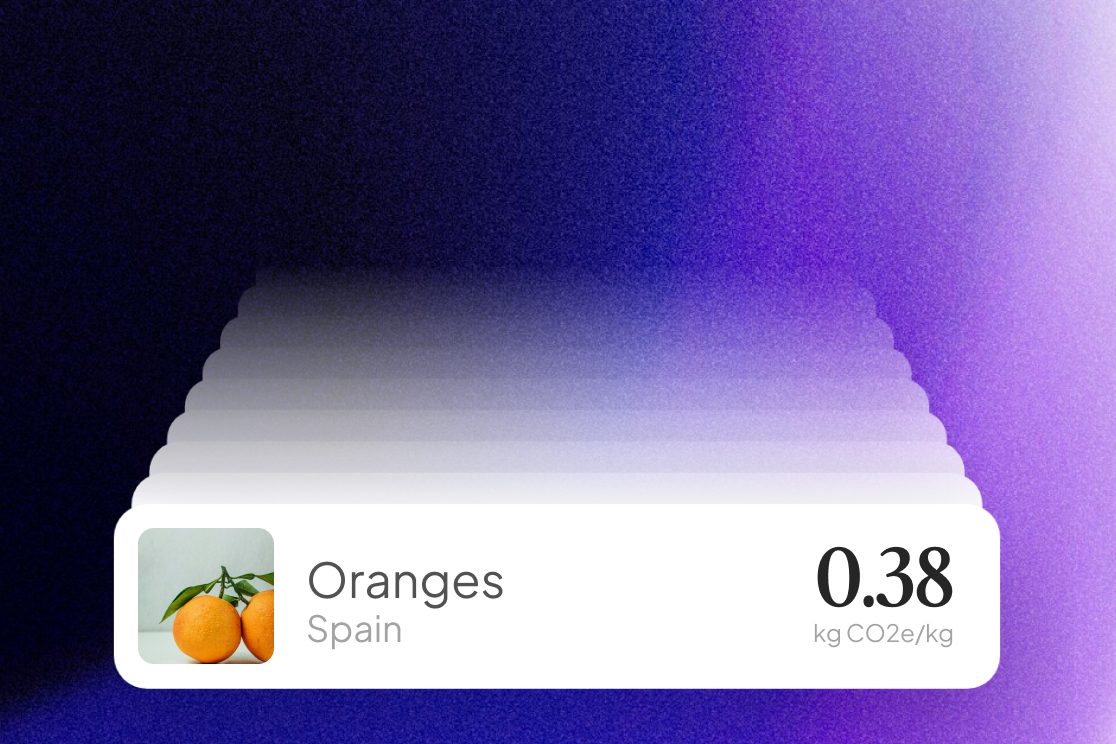
Superpower your system with thousands of high-fidelity climate footprints from all parts of the food system.
Integrate CarbonCloud’s climate footprint database with your system and develop emissions management operations or climate knowledge on a robust, comparable, up-to-date dataset.
What you can build on it
Live footprints
Keep your users up to date with live climate footprints for food.
Recipe calculations
Calculate the climate footprints of recipes using CarbonCloud’s ingredient data.
Food comparisons
Help your users compare the climate impact of different kinds of food.
The science
Decades of research, distilled into climate footprints
CarbonCloud is based on a biophysical model that has been developed over decades of scientific endeavors. Using primary data or benchmarks, the model calculates Scope 3 climate footprints quickly with the highest degree of accuracy.
Our database continuously expands with the latest knowledge through the work of our in-house science team and networked model.
Our methodology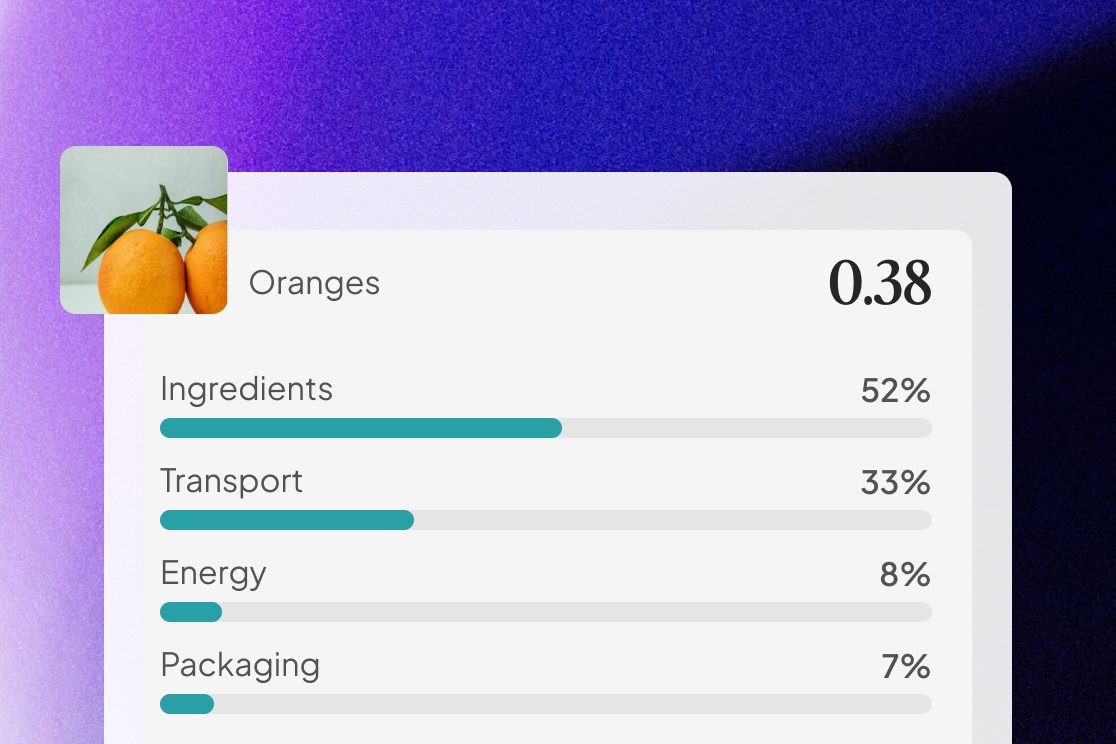
ClimateHub
Would you like a tour of our database?
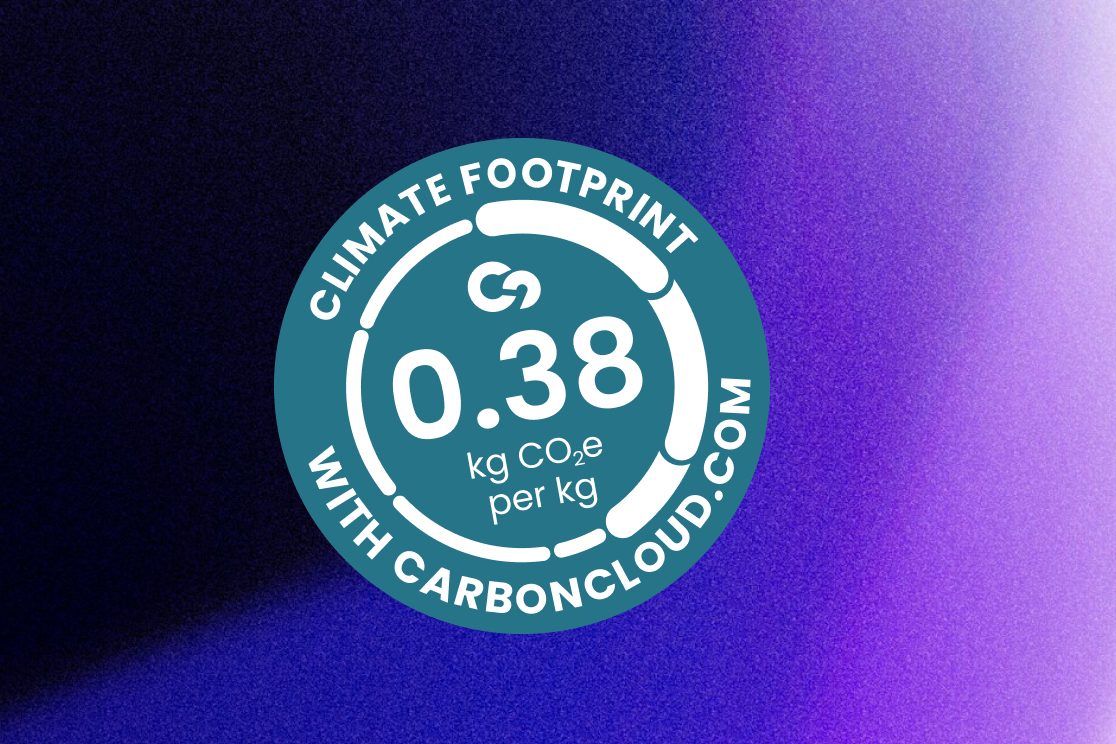
ClimateHub is our public window into the database. Browse climate footprints for thousands of food products, from farm to shelf, before you build anything.
Check out ClimateHubAPI access
Ready to plug in?
Tell us what you’re building, and we’ll set you up with access to CarbonCloud’s climate footprint data.