

Food brands
Climate transparency suits you. It works too
Show that you are doing your part in climate change. Give consumers, retailers, and regulators what they ask for: Not wishful thinking, just your climate impact in a number.
Contact usTrusted by industry leaders today and tomorrow







Climate transparency for brands
Engrave climate transparency into the core of your business
Calculate
Your climate impact, accurately quantified
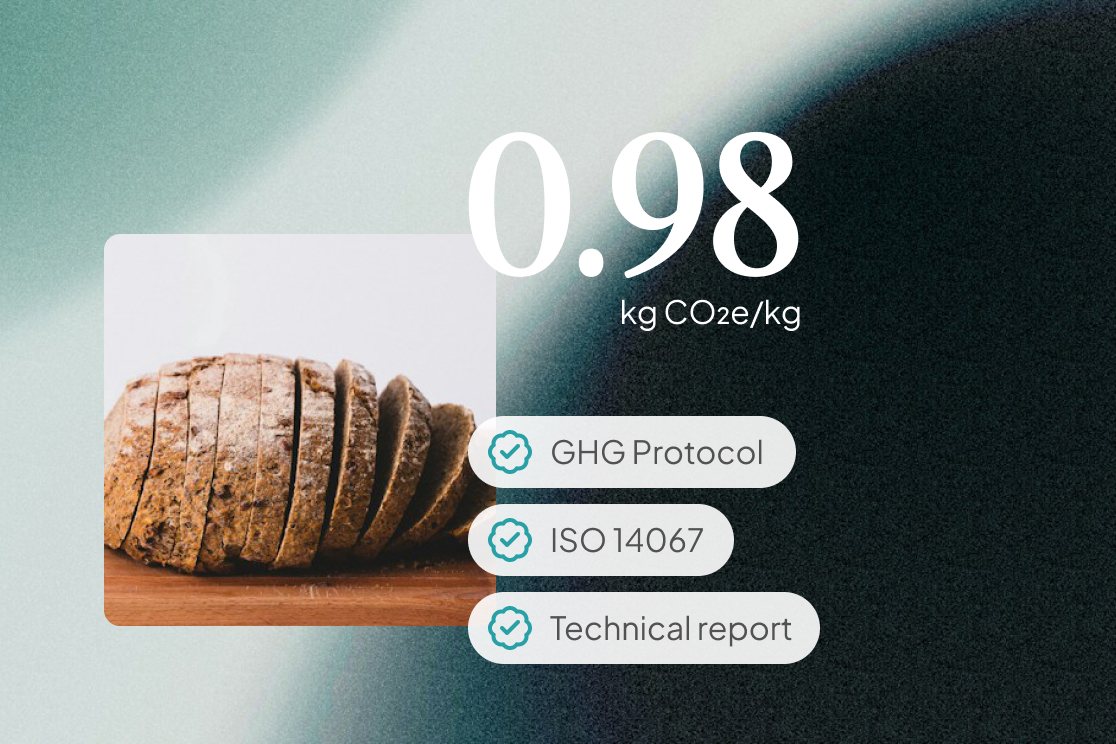
Focus on breaking new ground with your products and let CarbonCloud do the climate calculations. Every footprint is calculated to the GHG Protocol and ISO 14067, comes with a technical report that shows the assumptions behind it, and updates when the data behind it changes.
Compare performance on a level playing field. See and show how you stack up in the climate performance arena. All climate footprints in CarbonCloud are comparable, consistent, and calculated within the same system boundaries.

Communicate
Share your climate footprint, loud and clear
Green, eco, good for the planet is not cutting it for consumers or watchdogs. Make climate claims you can substantiate on request, and earn consumers’ trust, engagement, and brand loyalty. You only need one number: The climate footprint.
Your climate footprints are always transparent, always up-to-date, conforming to emissions metrics standards and backed-up by a complete technical report.
“For me, printing the climate footprints of each product is the way of helping consumers and ourselves as food brands.”

Annika Hansson
Sustainability Reporting Senior Manager, Oatly
Reduce
TENZING's climate transparency climb
TENZING Natural Energy used insights from CarbonCloud, set supply chain KPIs and activated reduction initiatives that drove the climate footprint of TENZING Original Recipe down by 23% in a year.
Read story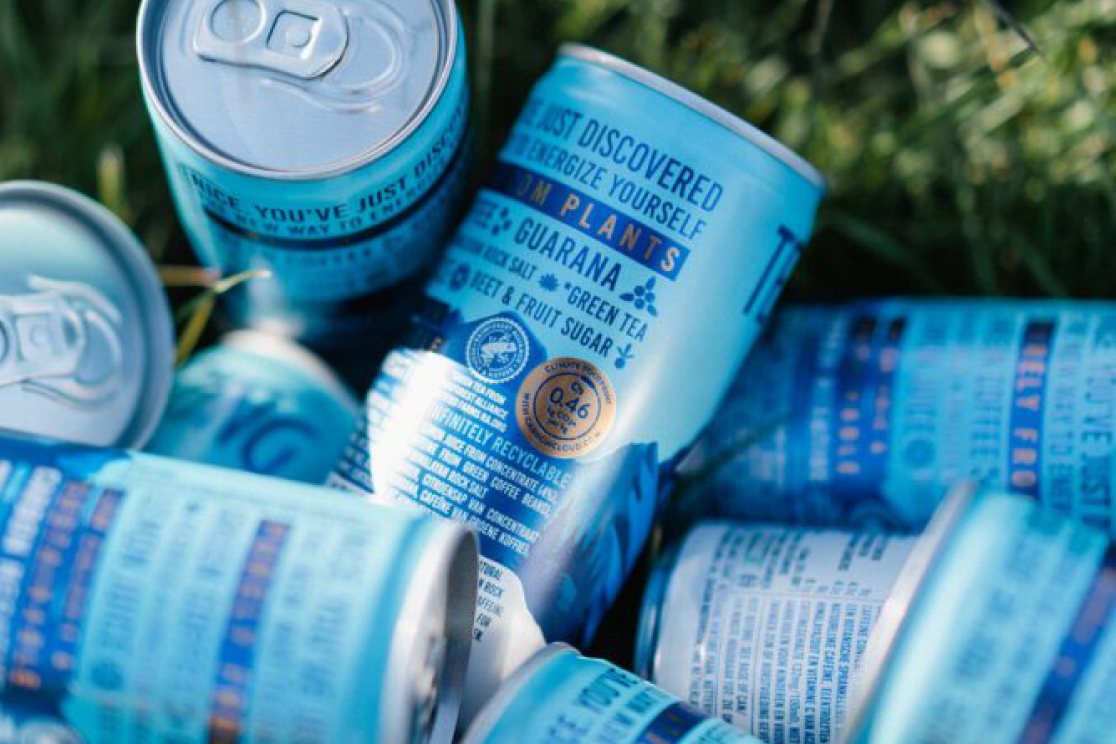
Report
Claims that withstand any stress-test
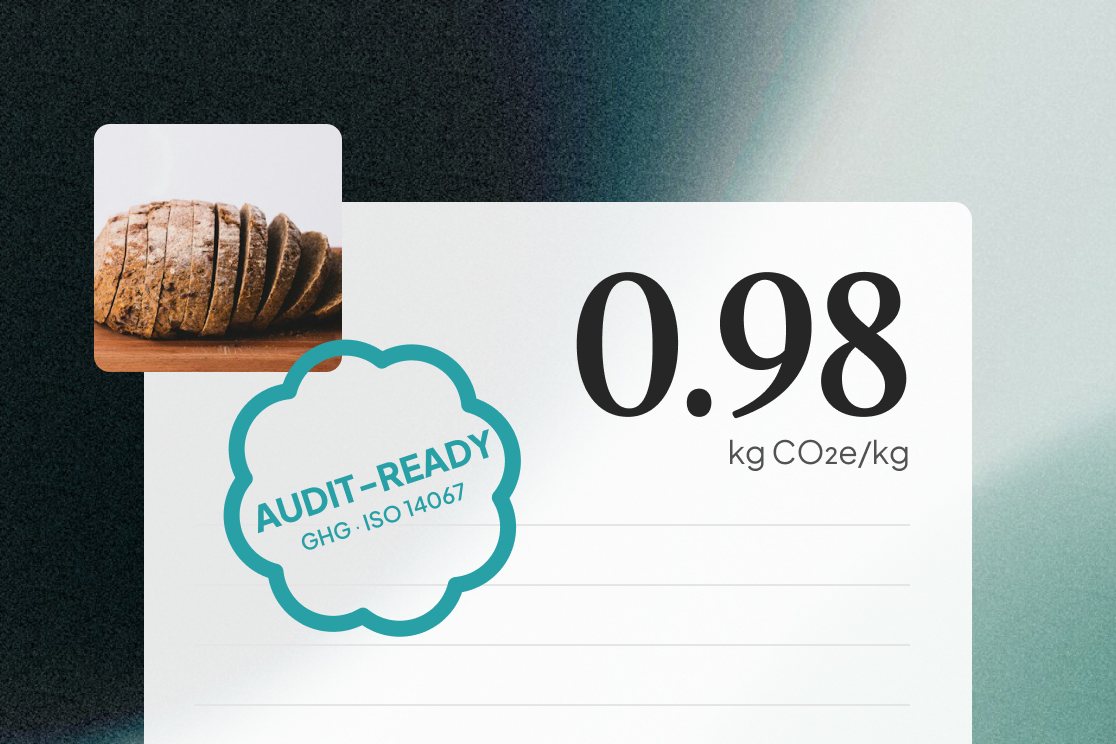
Share up-to-date, robust, auditable climate performance with retailers, voluntary disclosures, and target-setting entities.
Seamlessly respond to retailers’ call for Scope 3 data and even track the climate performance of your supply chain.
A standard-conforming technical report for every product is always at hand, backing your calculations while keeping your secret sauce.
A single robust number for all stakeholders:
TCFD emissions metrics
Emissions metrics for Section 4 of CDP, mandatory climate-related financial disclosures and all TCFD formats.
SBTi
FLAG and non-FLAG emissions separation for SBTi calculation. Base year calculation for SBTi (including FLAG) and consistent historical performance data for committed targets.
GHG Protocol
The technical reports are in the format requested by the GHG Protocol Product Life Cycle Accounting and Reporting Standard, and applicable to Purchased Goods and Services for retailers reporting under the GHG Protocol Value Chain Standard.
PEF
Cradle-to-gate GHG emissions metrics in the impact category climate change for PEF.
Source
Climate-proof your ingredients
Supply chain emissions are 11× larger than a food producer's own operations. In food, there are no reductions without your suppliers.
Procure the most climate-smart ingredients: explore your supplier options and swap between around 20,000 crop and animal products at the farm gate across 192 countries.
Explore Scope 3 management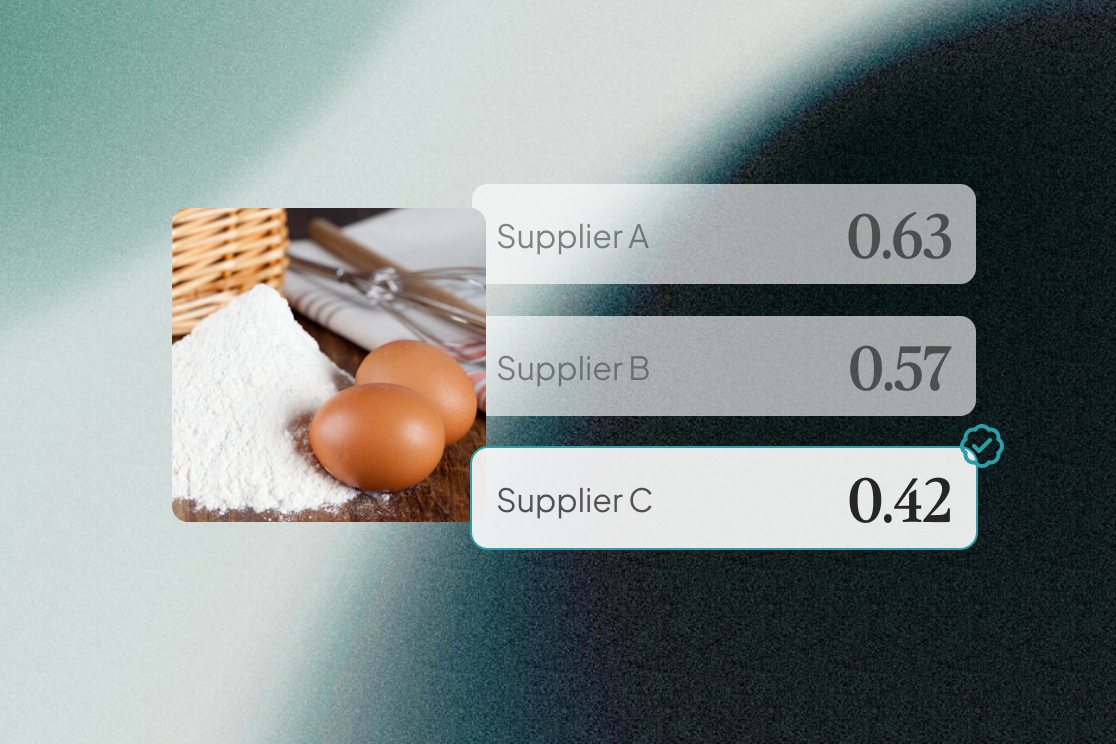

Reformulate
One recipe switch and a 30% reduced climate footprint later…
Mieke and her team at Cérélia are taking climate footprint reductions seriously. Since they started working with CarbonCloud, the OaYeah! pancakes can now boast a 30% lower climate footprint, a result of motivation, dedicated work, and actionable climate data and insights.
Read storyHow to get started
From decision to campaign in weeks
It doesn't take months to get your hands on your emissions map, really. Let computers do the calculations and focus on making your products climate-smart and letting the world know.
- 1
You
Input the data you work with on a daily
Simply list the portfolio data you already know by heart: product name, ingredients, country of origin, GTIN number.
- 2
CarbonCloud
Automated emissions modeling
Automated Modeling scans your input, matches each product to its supply chain model, and calculates the climate footprint.
- 3
You
Start walking and talking
Gain instant intelligence, identify hotspots, and start the reduction work, while climate transparency adds to your brand value.