The Climate Performance Maturity Model for the Food Industry
The world is racing to transform into a net-zero economy and industries are responding to the change. Automotive and logistics are electrifying, the energy sector is going renewable, a $130 trillion capital is committed to the net-zero transition.
Why is the food industry lagging behind?
Food supply chains are deeper and calculating emissions for food products is more complex than in other sectors.
What’s the plan?
This model was developed to answer this question for the food industry. It provides executives with a day-to-day roadmap to develop the maturity of their climate performance – successfully and sustainably.
The roadmap unfolds in 6 dimensions, covering strategy and intelligence architecture, target setting and tracking, and drivers along the supply chain as well as own operations.
What’s in it for me?
At the end of this model, food industry executives have the insights to orchestrate their climate strategy, manage climate performance, and secure the winning spot for their organization on the global race to net zero.
Contents
Download the guide and join the climate performance race
Foreword
For a third year in 2022, climate action failure takes the top spot as the highest- concerning risk in the World Economic Forum’s Global Risk Report [1]. While fossil use has been at the forefront of global discussions, the food system, contributing 34% of the global greenhouse gas emissions [2], is a “yes, and…”, even though food system emissions alone can put the 1.5°C target in jeopardy. However, contrary to Big Food’s climate pledges, food system emissions are projected to increase by 80% by 2050 [3]. If the global climate targets are ever going to be reached, the food industry needs to act on the solutions.
And there are solutions. Science and innovation confirm that climate change is solvable. Low-emissions interventions can lead to 40–70% less intensive production systems compared to today [4]. The timing for businesses to mitigate the most pressing global risk that will sweep corporate slow movers out of the market and securely cement their future existence is now.
Transitioning to a net-zero food system and market is more than mere risk mitigation – it is an opportunity that touches the entire food system. At COP26, the Glasgow Financial Alliance for Net Zero (GFANZ) committed to US$130 trillion to achieve net zero by 2050 [5]. More than 80% of consumers are willing to pay more for sustainable products in Europe, USA, and Asia [6]. Beyond sentiment, there is proof that consumers vote with their wallets: Products with sustainability claims in the US market accounted for 56% of the entire market growth in the last 5 years [7].
Beyond the positive economics, the market is mandating corporations to gain oversight of climate risks and opportunities. 35 nations and markets representing 56% of the global GDP are mandating climate-related financial disclosures. A corporation’s roadmap to measuring and managing climate performance is not only a must but it is evaluated as an investment risk or opportunity.
The food industry is in position for the most critical race since industrialization. Food executives are willing and ready to mobilize but are too often paralyzed in the face of putting these interventions into a roadmap. The food industry is left to its own devices to manage a crisis on an immensely complex issue, exacerbating climate inaction and making food corporations increasingly vulnerable to climate-related risks.
This is what The Climate Performance Maturity Model was articulated to support. CarbonCloud shares the strategic framework that predicates the effective transformation of the food industry to a net-zero economy. The roadmap derives from years of expertise in climate science, behavioral economics, and digital transformation, thousands of insightful data points, and countless interactions with food executives applying this expertise, iterating its application, testing, and confirming best practices around corporate climate performance for food.
PART 1
Roadblocks in the net-zero transformation the food system
The laggard results of the food industry’s current roadmaps are the result of epidermic problem identification and scattered initiatives, not of lack of intention or action. 2 main roadblocks have jammed climate progress in the food industry and triggered ineffective crisis responses.
1
The climate crisis is a quantifiable scientific phenomenon. Every action and initiative have a quantified effect in the crisis. However, assessing the climate performance of food has an added difficulty compared to other sectors. In the agricultural phase, emissions occur due to biological processes with diffuse emissions that are challenging to measure. The bar for learning how to assess this performance has historically been too high for business operatives to apply. Moreover, the scope and diversity of these studies are broad, resulting in unharmonized information.
2
Most importantly, emissions are distributed along complex supply chains and occur in majority at the deep end [8]. 27% of the global workforce is employed in agriculture [9] and a quarter of workers employed in the European food sector work in manufacturing [10]. Climate information needs to flow across over 1 billion individuals and nodes in this network and there is currently no set infrastructure for climate information exchange in a manner similar to quality and price. It is impossible to tell the emissions of a product or commodity by looking at it or compare the emissions of two products identical in price, quality, and chemical composition that could differ dramatically in climate performance.
The lack of visibility poses a challenge to decision-makers committed to improving their climate performance: Carbon management is unreachable in the existing structure. Current supply chain visibility solutions for less dynamic industries, such as annual audits or static climate footprints, simply do not solve the problem for the supply chains of food products. The reason for this is that the scale of the information that needs to be tracked to assess climate performance is staggering and it can be exemplified by the simplest product, such as a loaf of sliced bread at a grocery store. Assuming the simplest supply chain, measuring the climate performance of a single loaf of bread may entail over 190 parameters distributed across the stages and processes of the supply chain.
This ties together in a single roadblock: Tracing supply chain emissions in the food industry is an untackled but critical problem with a complex solution yet necessary to address climate change risks. To put it simply, there is no viable net-zero transition strategy in the food system without the supply chain.
Crisis responses
The food system’s transition to net zero is essentially a response to a crisis. However, the complex nature of the climate crisis does not always elicit the right response or an effective transition roadmap. The efficacy of each response determines a company’s speed and maturity trajectory, making or breaking its transition and survival.
➜ Freeze
Ignoring the problem and magnitude of the change
Freeze responders lack a problem diagnosis or were frictionless leaders pre-crisis and provide pre-crisis evidence to justify the “do nothing” approach. Post-2020, there are very few food companies that have absolutely no climate initiatives, so presently freezing manifests as minimum optics and no sense of urgency.
Case study: JBS
An example of the freeze response in the food industry comes from JBS, the largest meatpacker globally. JBS has been linked to deforestation and increasing emissions for years, leading Tesco and Carrefour to boycott their products even after JBS protesting the claims. In 2021, JBS prematurely communicated its commitment to science-based targets without an official approval from SBTi and with a questionable plan for emissions reductions. This action landed the American watchdog, The National Advertising Division, to mark the communication as misleading, with JBS appealing but ultimately dropping communication of one of the targets. In early 2023, JBS’s green bonds were reported to the Securities and Exchange commission for greenwashing, due to a lack of targets in Scope 3 – the supply chain. Since April 2022, JBS’s stock price dropped over 50%.
➜ Flee
Band aid solutions that check random boxes without a systematic approach
Fleeing is a localized response to the climate crisis of prioritizing optics and narrative-driven initiatives rather than reductions or data-driven initiatives. Companies in flee mode are not without the will or the motivation but lack a holistic diagnosis and consequently, a systematic solution.
Case study #1: Carbon Neutrality
The most recent historical example in the industry comes from the carbon neutrality claims coming under regulatory and media fire. It took some investigative reports on the quality of the voluntary offset market, and negative press to make companies claiming carbon neutrality, companies providing that certification, and advertising regulations such as the European Green Claims initiative, to phase it out.
Case study #2: Regenerative agriculture claims
The recently ubiquitous “regenerative agriculture and feed” initiative is the presently most prominent example of fleeing, already topping several unofficial greenwashing lists due to lack of proven quantitative results on lowering emissions.
Case study #3: Arla
The “climate neutral” claim from dairy giant Arla in 2022 was the subject of large scrutiny that ultimately led Arla to advance in climate maturity. Arla quickly withdrew the claim and replaced it with a reduction plan and initiatives. Finally, the recently ubiquitous “regenerative agriculture and feed” initiative is the presently most prominent example of fleeing, already topping several unofficial greenwashing lists due to lack of proven quantitative results on lowering emissions.
➜ Fight
Systematic change management grounded on exhaustive problem identification
Fighting entails acceptance of a) the magnitude of the crisis, and b) the necessity of holistic, change management, including internal change management with the right resource allocation, and time horizon. Companies fighting are determined to survive by mitigating risks gradually, optimally and systematically.
Case study #1: Oatly
It is unsurprising that companies in the fight response instantly evoke the concept climate work since their climate roadmap is their core business. Oatly’s entire business goal is to facilitate food system change for the health of the planet. As a result Oatly has quantified climate performance at all levels, articulated related KPIs and monitors progress continuously. Oatly has also vocally communicated its climate work with the 2020 landmark campaign Show us your numbers, while doubling its revenue in the same year [11].
Case study #2: Ben & Jerry's
Ben and Jerry’s has full stewardship over their supply chain, a clear focus on managing its emissions, and specific quantified KPIs addressing emissions hotspots. The brand’s portfolio diversification initiative has topped its category [12] and is scaling every year, their climate communication is transparent and the company has a self-imposed carbon tax since 2015 [13].
Sensing the pulse of the food and beverage industry now, more and more companies are shifting to fight mode – at the very least in terms of intentions and problem diagnosis. An increasing number of food manufacturers and retailers are acknowledging the impact of the supply chain and setting relevant targets.
Food industry executives determined to fight and win are often stuck between willing and unable. The Climate Performance Roadmap serves to advance the food industry towards able, put food industry executives in the driver’s seat of the transition, and support them in formulating their transition roadmap.
PART 2
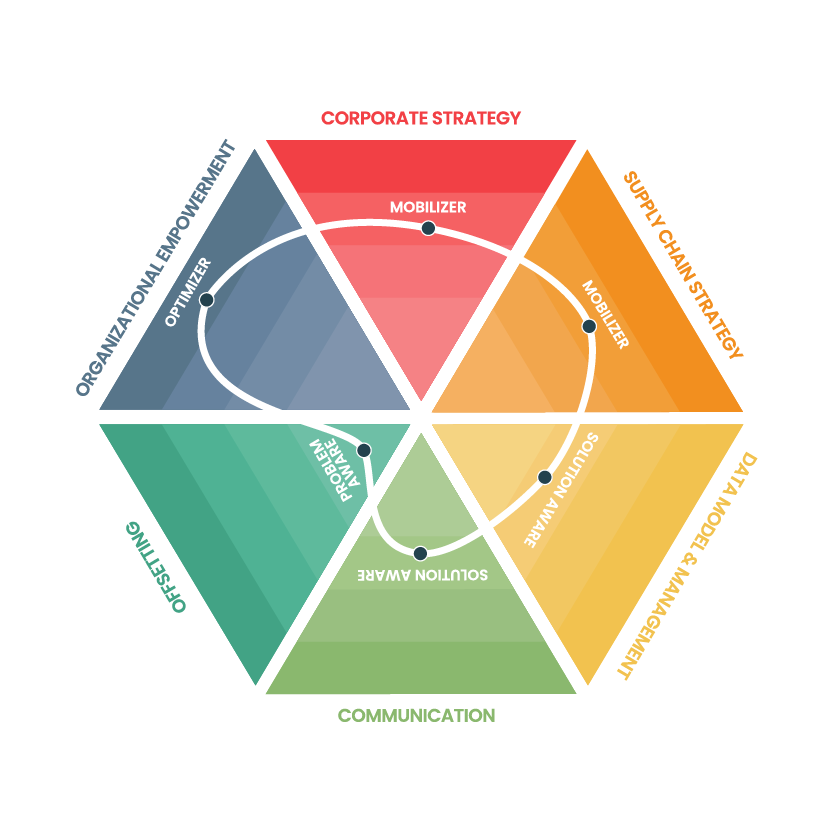
The Climate Performance Maturity Model
The roadmap unfolds along 6 dynamic, independent dimensions working in conjunction. A company can rank on any of the four levels of climate performance maturity, based on how engagement develops. Consequently, the same company may display different stages of maturity in each of the dimensions, however, a laggardness in one dimension may block the company from advancing in another. Executives can survey their company on all 6 dimensions and identify their organization’s first gear and immediate next steps.
- Dimension #1: Climate corporate strategy
- Dimension #2: Supply chain management
- Dimension #3 Climate data management
- Dimension #4: Climate communication
- Dimension #5: Climate compensation/offsetting
- Dimension #6: Organizational empowerment
In each dimension, the four levels of climate performance maturity are based on how engagement develops.
Maturity analysis per dimension
DIMENSION #1
Climate Corporate Strategy
In his book Good Strategy, Bad Strategy, Richard Rumelt outlines: “A good strategy is a specific and coherent response to overcoming the obstacles to progress. A good strategy works by harnessing and applying power where it will have the greatest effect” [19]. Rumelt counts 3 elements in a good strategy: A diagnosis that simplifies the complexity of the issue, guidance to overcome the obstacles, and a set of coherent actions designed to carry out the guiding policy.
Applied to the climate crisis, this dimension outlines the definition and implementation of a climate performance strategy: Where emissions are, what are the actions for each hotspot, and how they will be prioritized. Organizations that want to gain top fitness on this dimension, need to diagnose the problem correctly with an emissions baseline; lay out their guiding policy with quantified emissions reduction goals and ownership; and prioritize actions towards the defined goals based on a) what can be acted upon b) that has the largest effect and c) can be financially supported.
A proactive strategy definition is imperative in order to minimize costs, articulate the relevant trade-offs, and set guidance for employees. The level of ambition and engagement will define the pace, budget, and ultimately the company’s maturity advancement.
- Climate change is perceived exclusively as a reputational risk, without accounting for operational or transitional risks.
- Companies disengaged with climate improvement have reduction goals in place that are disconnected from their emissions profile, selected without an emissions baseline, and based on popular appeal.
- Reduction initiatives and ownership are taken ad hoc and unsystematically.
- The company needs an emissions baseline and hotspots, applicable targets, a roadmap, or an internal reporting structure to advance.
- The company is aware of its emissions roadmap and runs diagnostics with an emissions baseline in place and navigation of hotspots.
- A data-driven roadmap and prioritization of initiatives is in development.
- Experimentation for reductions with product development is initiated.
- Internal reporting on the process is in place but clear internal accountability and task ownership are still undefined and necessary to advance.
- A roadmap with priorities and a timeline are in place.
- Mitigation actions with defined department ownership are initiated.
- Product development has integrated climate performance as a KPI – iteratively in existing products and as a primary target in new products.
- Key functions of the organization have clear accountability on climate targets and reporting covers annual progress against quantitative goals.
- The company needs to transform the new modus operandi across the organization and portfolio into business as usual and to advance to optimization.
- Products that cannot fulfil the climate targets are discontinued and climate performance is in optimization for the rest of the portfolio.
- All levels of the organization have defined climate accountability, with quarterly reporting and quarterly reduction goals in place.
- Climate performance is part of the value proposition and the company is involved in shaping regulatory discussions and industry best practices.
DIMENSION #2
Supply Chain Strategy
For fast-moving consumer goods and particularly food, 80%-95% of the emissions happen early in the supply chain. Transparency on climate performance and any actions on emissions reduction must involve the supply chain. To act on the majority of the emissions effectively, the organization needs to define a clear strategy to collect, manage and exchange supply chain data, set targeted requirements, and delegate accountability to suppliers.
This dimension outlines the ways an organization accounts for the climate performance of the entire supply chain. Evaluating how to include the supply chain in the strategy has large implications on the choices of tools, initiatives, and pathways in the climate roadmap. Consequently, the choice of tools for mapping and understanding the supply chain determines a company’s timespan and budget for supply chain reductions, the degree to which suppliers can be held accountable, and their ability to live up to targets.
- If the supply chain is accounted for in the company’s emissions profile, the baseline is incomplete and based on scattered, unharmonized data – generic or collected manually.
- Reduction initiatives are non-existent or inconsistent with the emissions profile of the supply chain.
- Suppliers may be asked to pledge in voluntary schemes but no other accountability is delegated and climate performance information is not audited or validated.
- The supply chain is modeled with harmonized product-specific assessments based on representative data.
- The roadmap for supply chain engagement, timeline, targets and incentives is in development, prioritizing supply chain hotspots from the modeling, and expectations are shared with Tier 1 suppliers.
- Supply chain climate performance is reviewed annually.
- Suppliers with potentially jeopardizing climate performance are involved in the assessment and review of their climate performance.
- The climate performance infrastructure is shared with suppliers, who own data provision. Supplier data inflow is automatically harmonized and added to the company’s supply chain emissions map.
- Suppliers who are already part of the map propagate next-tier engagement, have defined incentives, reduction targets, and initiatives relevant to their emissions profile, reviewed annually.
- Supplier climate performance is embedded in Procurement. R&D and product development proactively search for opportunities and risks in the supply chain.
- Suppliers who don’t comply or propagate the work within the presented timeline are discontinued.
- The company has a full map with primary data at every node of its supply chain network with automatic instant updates.
- Data updates are automatic.
- Supplier climate data is regularly audited and supplier reduction roadmaps and climate performance are reviewed quarterly against targets.
- Emission reduction innovations are in place and monitored with suppliers.
- Purchased goods with no decarbonization alternatives are discontinued.
DIMENSION #3
Climate Data Management
This dimension refers to how the organization processes the collected data and translates it into insights. It addresses perhaps the two most prominent hurdles in assessing the climate performance of food:
1) Lack of infrastructure for climate performance data exchange
The food industry currently uses surveys, spreadsheets, and manual channels to exchange climate performance data. This is not only a costly alternative and waste of resources, but insufficient [k]. The singular solution a digital infrastructure with automatic capabilities in data exchange and data definition in the supply chain emissions map.
2) Lack of standardization in measurements
Climate performance measurement frameworks do exist but leave a lot of room for decisions. As a result, companies that measure their climate performance with the same framework end up with incomparable results. Even with full access to all the relevant data, if the data collection is incohesive, the results from different climate performance assessments can differ by more than 30% depending on details in the assessment. A unified measurement solution must be embedded in the digital infrastructure.
The choice of climate data infrastructure determines the pathways of the previous two dimensions: corporate and supply chain strategies. But most importantly, the digital infrastructure determines the risk and opportunity insight quality and what reduction initiatives can materialize.
- The company may rudimentary assessments of Scope 1 and 2 (corporate and direct electricity use emissions) annually, and scattered life cycle assessments with static results.
- If there is a Scope 3 (supply chain) metric, it is assessed once with screening and no plans to increase data quality.
- There is no holistic infrastructure in place, data is often inconsistent and uncentralized.
- A partial portfolio assessment is in place, either at full portfolio with generic data for the supply chain or a product range with a relatively increased data quality. The results are dynamic and automatically updated.
- Existing climate performance data is centralized in the infrastructure but may require manual reconciliation.
- The company owns data collection for the supply chain and has not delegated to suppliers yet.
- The company’s portfolio is fully assessed and data definition from the supply chain is increasing.
- Automation for climate performance data exchange is in place and in use for the supply chain.
- Climate performance data is centralized and new data from the supply chain flows straight into the digital infrastructure with automatic consolidation and updating capabilities.
- The company reviews its data every six months and has initiated a data audit plan.
- Climate performance data definition throughout the supply chain and across the portfolio is at maximum.
- Data updates and consolidation are fully automated and at a monitoring phase.
- The data is reviewed quarterly and the company performs regular data audits for material weaknesses.
DIMENSION #4
Climate Communication
There is a large business opportunity in proactively communicating climate performance with transparency. Consumers have been voting with their wallet and in the last 5 years, packaged goods with sustainability claims accounted for 56% of the entire market growth [7]. By catering to this demand through climate performance visibility, a food brand incorporates climate performance into its core business as a differentiator, win return sales up to 34%, and claim a price premium between 16-35% [7].
Consumers are a food company’s opportunity – but regulations are the risk. More and more nations are developing guidelines and requirements around what an environmental claim must and must not disclose. The advertising authorities in mature markets are crystallizing their guidelines towards specific, measurable, traceable claims [17, 18, 19]. Moreover, 35 markets representing over half of the global GDP are mandating climate-related financial disclosures, aiming for an assessment of the industry’s climate risk management strategy.
Finally, as the food industry matures in emissions management throughout the supply chain, climate performance is increasingly becoming a differentiator for suppliers. For suppliers, the time to leverage quantified emissions data provision as a competitive advantage is right now – before supply chain emissions management hits critical mass.
- Climate performance is communicated in an aggregation of sustainability issues or corporate-level initiatives.
- Marketing claims are qualitative, often future-oriented, and derive from palatable narratives as opposed to data.
- The company relinquishes performance credibility to voluntary frameworks, reporting with minimum requirements.
- The company communicates the climate performance of its products quantitatively and with verification. Auditability capabilities are limited.
- Reporting is data-driven and focused on performance against individual, specific targets.
- Climate performance is quantitatively communicated and verified across the entire portfolio.
- All claims are auditable with version tracking.
- Results from emission reduction initiatives and innovations, and performance against targets are also a part of vendor- or consumer-facing communication as well as reporting.
- Every product is labeled with a climate performance indicator linked to a live digital report with complete supply chain transparency.
- Audit trails and time series for climate performance are publicly available for every product.
- Historical climate performance against all targets is disclosed in real-time and data export with the latest updates for reports is automatic.
- The company is lobbying for emissions reduction regulations and feeds best practices to the industry.
DIMENSION #5
Climate Compensation/Offsetting
Climate compensation will play an important role in climate change mitigation to reduce CO2 levels in the atmosphere in two instances: 1) When the emissions have ceased, and 2) to cover for emissions that are difficult, extremely expensive or even impossible to completely mitigate, such as nitrous oxide from agriculture.
This is proven by the correlation of offsetting credits available and the current corporate inventory coverage. The total amount of carbon available for sequestration is just north of 3,000 tonnes. That is barely a drop of water in the ocean of emissions from the food industry, which in 2015 only amounted to almost 18 billion tonnes [19].
At the moment, the market is awash with offsetting offers that range from purely fraudulent to well-meant but unable to keep their promises. Many are nothing more than creative bookkeeping. Others are serious and scientifically solid but tend to be more expensive by orders of magnitude and not commercially feasible or even unavailable.
A company’s offsetting approach is one of the most telling pieces of a company’s trajectory in climate performance.
- A substantial budget for climate risks and opportunities is funneled towards nature-based offsets or “insetting” with unquantifiable returns.
- Compensation initiatives are communicated in conjunction with reduction initiatives or as an aggregation with “carbon neutral” claims.
- Part of the budget previously invested in offsets is relocated towards data-driven analysis and reduction initiatives.
- Offsetting is communicated alongside the absolute climate performance of the company and its products.
- Climate performance is quantitatively communicated and verified across the entire portfolio.
- All claims are auditable with version tracking.
- Results from emission reduction initiatives and innovations, and performance against targets are also a part of vendor- or consumer-facing communication as well as reporting.
- The Offsetting budget is invested in pilots towards 100% proven evidence-based carbon capture measures.
- Emissions and offsetting are kept separate in reports and public-facing communication.
DIMENSION #6
Organizational Empowerment
Organizations are the people working in them. No actions will be taken and no goal will be reached unless the employees understand why climate performance is important, what to do about it, and the empowerment to act. Employee engagement increases effective decision-making.
Much like digital transformation, getting to net zero is, at its core, change management. As any leader knows, change management is an orchestrated team effort achieved by dedicated champions and morale late bloomers alike. Miss engaging your employees in your climate strategy and it is destined to be equally less effective, less profitable or even unfruitful.
This dimension delineates the degree to which employees are aligned with a shared vision of the organization and to what degree they are empowered to perform the necessary actions to reach their goals.
- Management is aware of the importance of climate risks but at this stage, mobilized to fulfill legal requirements with minimal effort.
- Climate performance is an area single-handedly managed by the Sustainability or CSR department, which operates in the periphery or as an add-on and has little mandate to delegate targets across the organization.
- Top-level management has taken the decision to incorporate climate performance into core business. The Sustainability department extends awareness to other departments and calls for internal expertise.
- Relevant departments have specific targets, the mandate to run climate performance pilots and evaluate ways of working.
- Accountability and engagement are propagating in most departments, that have owned climate goals.
- Key functions are incentivized for improved climate performance.
- The majority of employees have received introductory training in climate performance essentials.
- All departments have their own climate goals and incentives for improved performance.
- Climate performance is part of regular monitoring within each department.
- All employees are knowledgeable on the essentials of climate performance from internal champions and are enabled to continuously develop.
- Climate performance training is part of onboarding all new employees.
Conclusion
The food industry is in the starting position of the most critical race since industrialization. Executives are willing and ready to mobilize but are too often tangled in action paralysis or convinced to sprint a marathon.
This Climate Performance Maturity Model was articulated to ensure that every food executive crosses the finish line of the race to net zero without losing track, stamina, or supporters along the way. The model derives from years of expertise in climate science, behavioral economics, and digital transformation, thousands of insightful data points and countless interactions applying this expertise, iterating its application, testing and confirming the best practices around corporate climate performance for food.
Much like any instance of transformation, racing to net-zero is ultimately change management. What decision-makers need to succeed is a roadmap, a tool to walk the roadmap, ownership, and of course, continuous iteration.
As any seasoned executive already knows, change is effectively managed when leaders know when and how to steer to drive the desired effect. As any leader knows, success is an orchestrated team effort achieved by dedicated champions and morale late bloomers alike. As any athlete of any level knows, race fitness is not achieved in a once-in-a-lifetime sprint but through iterative training and day-by-day breakthroughs and improvement.
It just happens that this particular transformation change is unlike any other – It is the race of the century and the food industry is in a central position to place the entire humanity on top of the podium. By sharing this model, as well as open-source data, we intended to demonstrate our team’s passion and commitment to find solutions for the Food Industry’s race to net zero.
What is unfortunate is that the food industry is left to its own devices to manage change on an immensely complex issue – and manage it fast. The good news is that it is perfectly manageable as long as it is effectively mapped and measured. The better news is that there are platforms that can act as a digital catalyst.
This is where we are convinced CarbonCloud has a role to play. CarbonCloud’s climate intelligence platform is the solution where we put our knowledge and skills to create the supporting digital capabilities to unite every part of the food industry. We’d be glad to show you how it accelerates your journey towards our common mission.
1 World Economic Forum. (2022). The Global Risks Report, 17th edition.
2 Crippa, M., Solazzo, E., Guizzardi, D., Monforti-Ferrario, F., Tubiello, F., & Leip, A. (2021). Food systems are responsible for a third of global anthropogenic GHG emissions. Nature Food, 2(3), 198-209. doi: 10.1038/s43016-021-00225-9
3 Costa, C., Wollenberg, E., Benitez, M. et al. Roadmap for achieving net-zero emissions in global food systems by 2050. Sci Rep 12, 15064 (2022). https://doi.org/10.1038/s41598-022-18601-1
4 Poore, J. and Nemecek, T. (2018) ‘Reducing Food’s environmental impacts through producers and consumers’, Science, 360(6392), pp. 987–992. doi:10.1126/science.aaq0216.
5 Amount of finance committed to achieving 1.5°C now at scale needed to deliver the transition | Glasgow Financial Alliance for Net Zero. (2021).
6 Blasberg, J., Davis-Peccoud, J., Duchnowski, S., & Tam, V. (2022). Food System Transformation: The Time Is Now. | Bain & Company.
7 McKinsey. (2023). Consumers care about sustainability—and back it up with their wallets.
8 McKinsey. (2022). Navigating the market headwinds – The State of Grocery Retail 2022, Europe.
9 World food and agriculture – statistical yearbook 2021. (2021). FAO.
10 Eurostat. (2020, May 22). Employment in food supply across EU regions. Eurostat.
11 Oatly. (2020). Confessions of an Oat Company – Sustainability Update 2020. Oatly.
12 Ben, & Jerry’s. (2021, May 4). Ben & Jerry’s tops Non-dairy category, releases five new flavors. PR Newswire.
13 Ben & Jerry’s Puts a Price on its Carbon. (2019, August 30). Ben & Jerry’s. https://www.benjerry.com/values/issues-we-care-about/climate-justice/internal-carbon-tax
14 Rumelt, R. (2011). Good Strategy Bad Strategy: The Difference and Why It Matters. Deckle Edge.
15 Stenzel, A., Waichman, I. Supply-chain data sharing for scope 3 emissions. npj Clim. Action 2, 7 (2023). https://doi.org/10.1038/s44168-023-00032-x
16 Green Claims Code. (n.d.). Gov.uk. Retrieved November 13, 2023, from https://greenclaims.campaign.gov.uk/
17 Green claims. (n.d.). Environment. Retrieved November 13, 2023, from https://environment.ec.europa.eu/topics/circular-economy/green-claims_en
18 Green Guides. (2018, October 31). Federal Trade Commission.
19 Doucet, U. P. (2021, March 9). Food systems account for over one-third of global greenhouse gas emissions. UN News. https://news.un.org/en/story/2021/03/1086822
CLIMATE MATURITY ASSESSMENT
How net-zero ready are you?
Take CarbonCloud's 3' Maturity Assessment quiz to find your starting point and get tailored tips and action points on how to step up climate work throughout your organization.