
Climate Action in the Food Industry: Half-Baked Efforts as 44% of Companies Remain at Initial Maturity Level

Related Posts
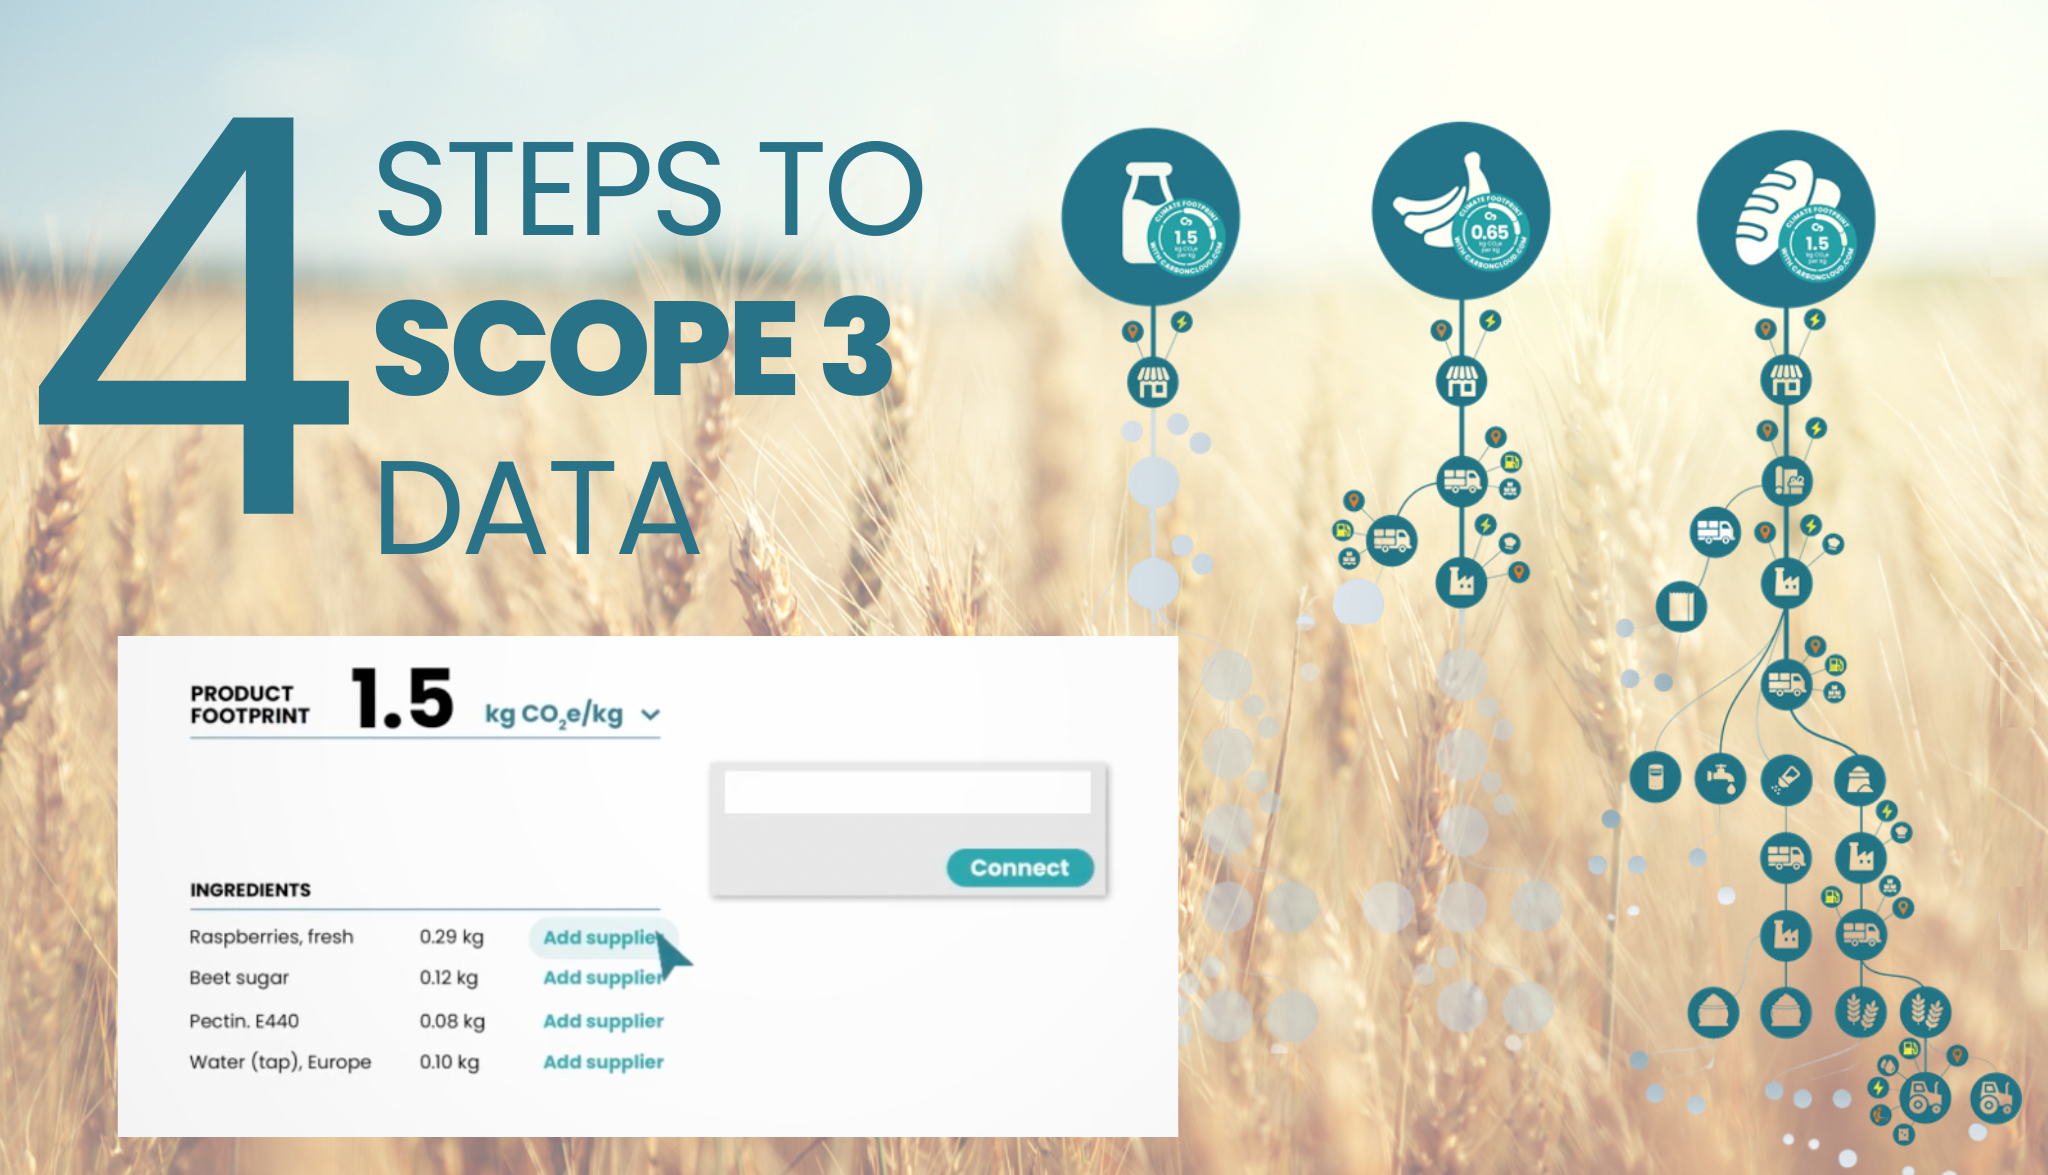
4 steps to Scope 3 data: Roadblocks & how to overcome them
Food & beverage industry + Emissions + Elephant in the room = Supply chain data. Upstream Scope 3 data is a problem the entire food industry has identified but no one has successfully solved – y

Planet A Foods sells 92% CO2e savings – and the food industry is buying
One could say that Planet A Food’s main product is CO2 savings. One could say that, if Planet A Food’s flagship product, Nocoa, wasn’t taking over the confectionery world. Planet A Food’s oat
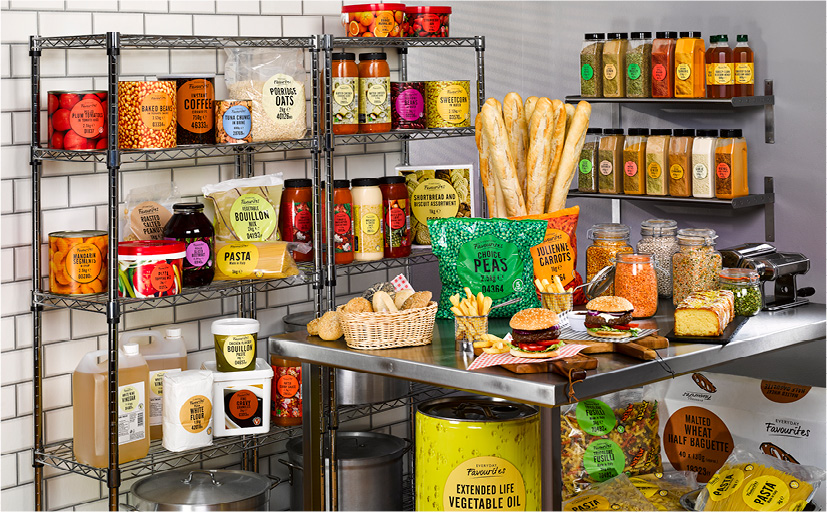
Bidfood and CarbonCloud Join Forces to Initiate Transformation in Supply Chain Carbon Management
Bidfood, one of the UK’s leading foodservice providers, has announced a strategic collaboration with CarbonCloud, a pioneer in climate intelligence technology. This partnership marks Bidfood’s
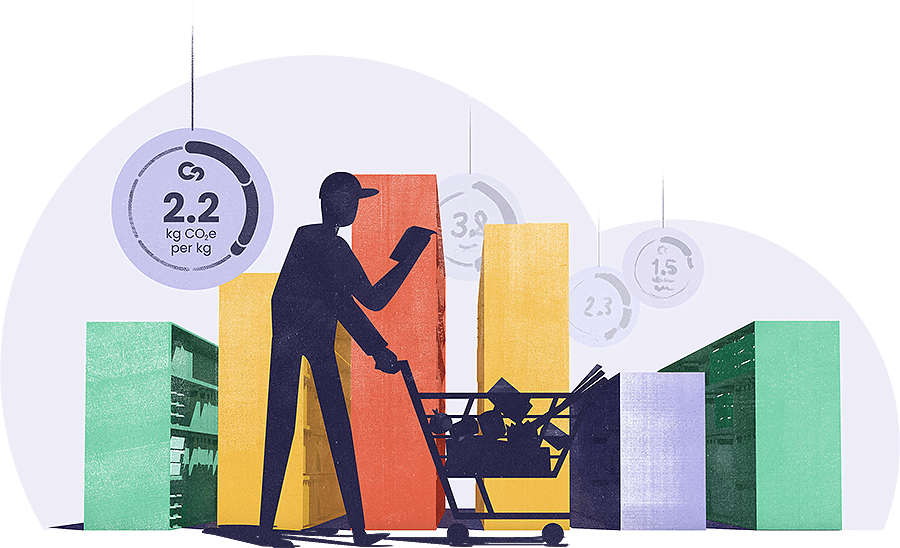
Grocery shopping with a climate budget: Jeff’s diary
What exactly does a climate footprint label mean? What does it translate to on the store shelves and our daily plates? Shopping with a climate budget works similarly to our weekly grocery budget: Some