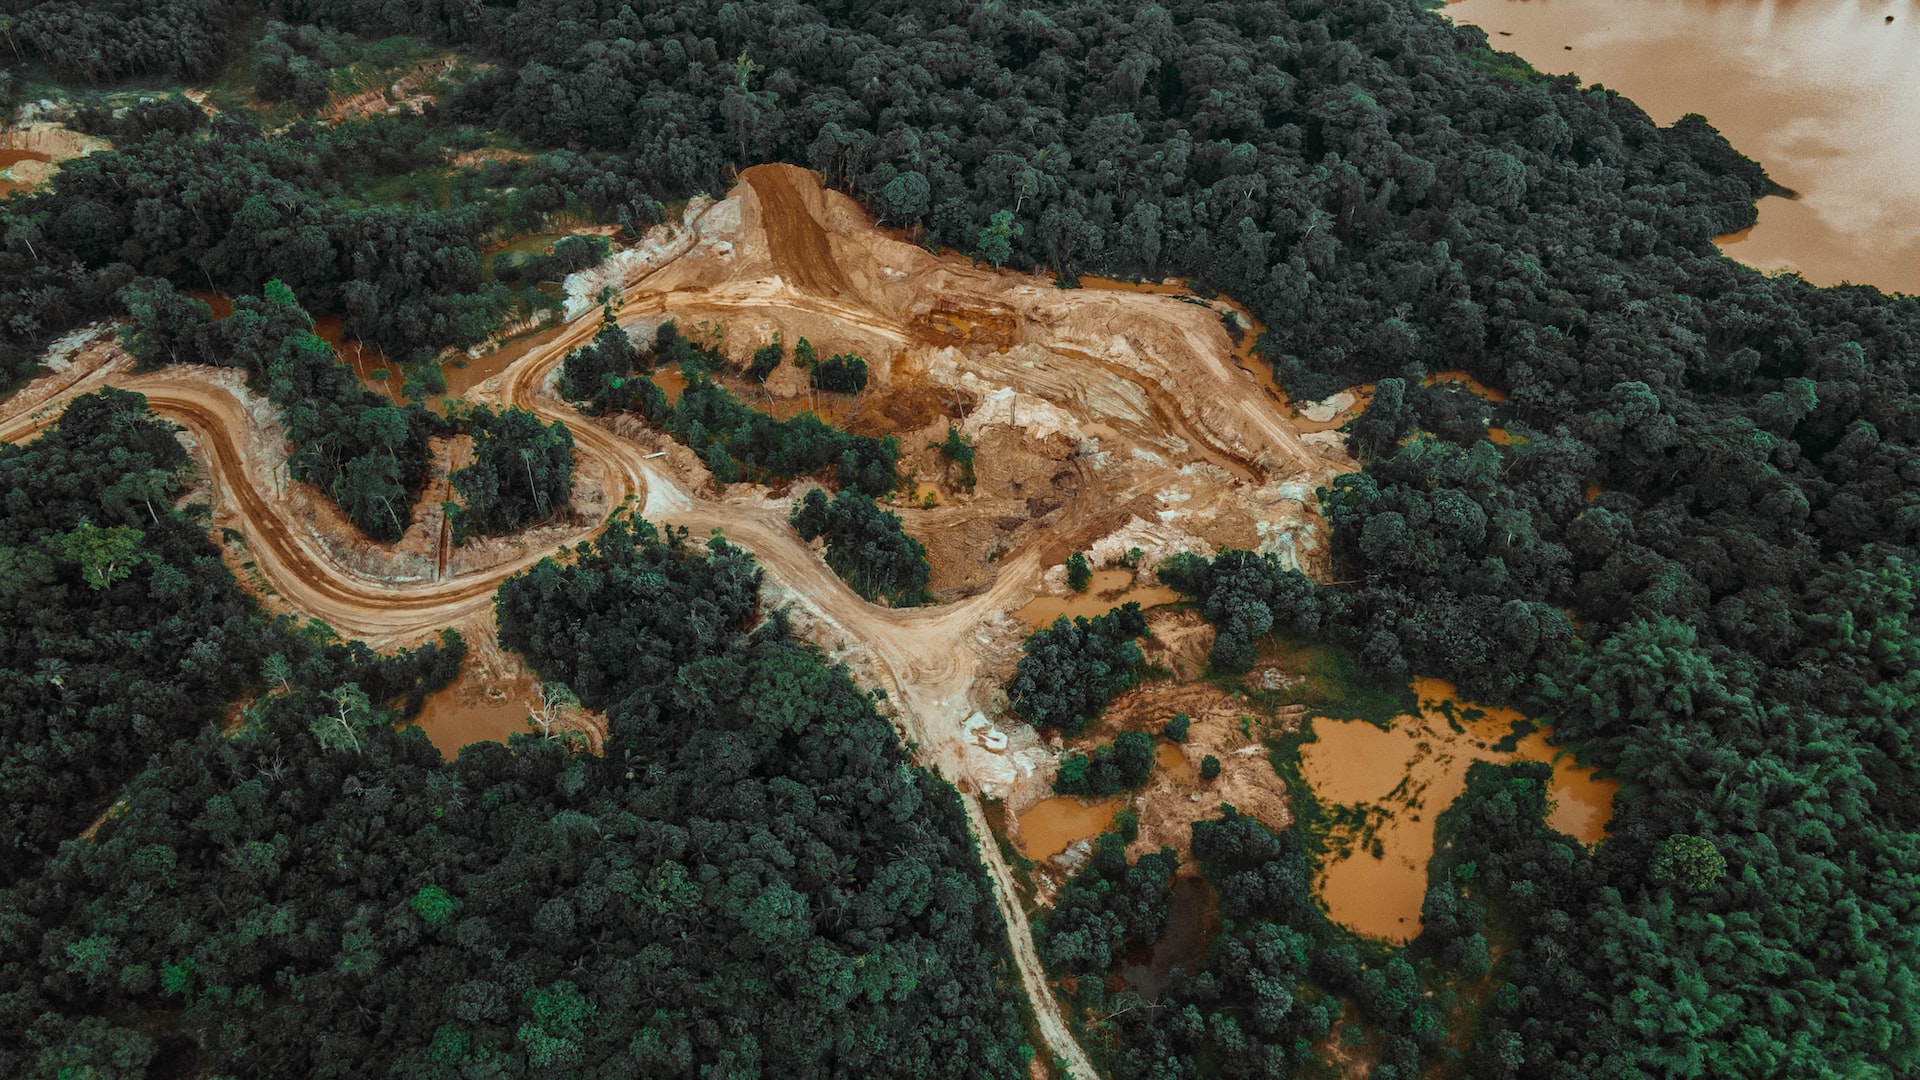
The Pendrill et al model of deforestation attribution
The Pendrill et al. model is based on the following general premises, supported by data on land-use change related to tropical deforestation:
The model attributes deforestation emissions to pasture, forest plantation and crops based on how much each type of land use expands into forest land.
– When a type of land use -and its related commodities- have not expanded, no deforestation is attributed to them.
– When the total forest loss is larger than the expansion of the other land uses combined, the excess deforestation emissions remain unattributed.
– When there is no cropland expansion, but forest plantation expansion and/or pasture expansion, deforestation is attributed solely to the latter two land use changes. Where does this scenario apply in real life? Typically, this is the case in Brazil. In Brazil, we can see that the total cropland has remained quite stable for the last 5 years, while permanent pastures have expanded. This means the vast majority of the impact of deforestation is attributed to pastures and cattle.
– When there is cropland expansion that exceeds gross pasture loss, the related deforestation is attributed to cropland expansion.
– When cropland expansion does not exceed gross pasture loss, all deforestation is attributed to pasture expansion and forest plantation expansion in accordance with the model above where cropland expands into pastureland first.
And the emissions?
In sequence, the emissions from deforestation are then allocated to the different products that come from forest plantation, pasture and individual crop types based on how their production has changed. Further, to account for the fact that, while deforestation is a one-time event, the cleared land typically yields agricultural and forestry commodities over many years, the deforestation emissions attributed to a given land use are spread equally over production from that land for 5 years after the deforestation occurred.
Cropland expansion exceeding gross pasture loss is a common case in Colombia and Peru, where cropland has been growing substantially in the last 5 years, and together with a growth in coffee production, it results in a major part of the impact from deforestation being allocated to coffee beans.
The “Did you know?” part of the research
Florence Pendrill, Martin Persson, and their peers have done some pretty incredible work, right? We are not the only ones who think so. Their 2022 research “Disentangling the numbers behind agriculture-driven tropical deforestation” was published in Science and has generated some valuable insights as well as interesting media attention. We cherrypicked some illuminating insights:
- Cattle pasture expansion is the single most important deforestation driver by far. It accounts for approximately half of the deforestation resulting in agricultural production
- The following most important deforested land uses are oil palm and soy cultivation, amounting to 1/5 of the deforestation resulting in agricultural production.
- Looking at what happens to the products that come from deforested land, Pendrill et al outline that 35% of deforestation is linked to global demand. The majority of the exported products are soybeans, palm oil, rubber, coffee, and cacao.
- Cattle products are mainly consumed domestically and, with pasture accounting for half of the deforestation emissions, domestic demand is a primary underlying driver of deforestation resulting in agricultural production.
- However, deforestation drivers are in a dynamic relationship: For example, in South America soy expansion in one location has been linked to pasture expansion in others; in Indonesia, timber harvesting often occurs first, followed by palm oil expansion.
As a food producer, as a buyer of food products, as well as a citizen, the more you know about deforestation, the bigger the difference you can make. When it comes to sourcing products, using a database of climate footprints to source the climate-smart alternative can save you kilos and kilos of greenhouse gas emissions. As a buyer, having comparable climate footprints per product can help you purchase the alternative with the lightest emissions. As a consumer and citizen, you can’t know until you know – but you have power: Demand tighter regulations on deforestation and climate transparency in all food products.