Comparing apples & oranges: Climate footprints of 10,000 food products revealed
ClimateHub, the free-access carbon footprint database by CarbonCloud, digitally releases the climate footprint of 10,000 branded food and beverage products at the American grocery store shelves. Ahead of World Consumer Rights Day on March 15th, American consumers can exercise their right to information about the climate impact from their most frequent purchase: Food.
This is a bold yet inevitable move”, says David Bryngelsson, Ph.D., CEO and founder of CarbonCloud. “Considering the severity of the climate crisis and the investment of citizens in climate action, the climate impact of consumer goods should be publicly available information, a driver for consumer decisions. If the food companies or the grocers themselves have not yet made it available, we decided we should.”
The library of carbon footprints includes the most prolific food and beverage products, such as Lipton tea, Campbell soup, Barilla pasta and Tyson packaged meat.
The carbon footprints were calculated with CarbonCloud’s automated emissions modeling engine from openly available ingredient data. The results are calculated from farm to shelf, including supply chain emissions – the majority source of emissions typically in food products – and with the same system boundaries, making all quantified carbon footprints comparable with each other.
The open access to the carbon footprint of 10,000 products comes just in time for World Consumer Rights Day, on March 15th and responds to the loud consumer demand for transparency. 87% of consumers are willing to pay more for sustainable products and over half of them claim that they are willing to change their shopping habits to reduce their environmental impact. The response of the food industry has been partial. Carbon footprints are cramped in corporate sustainability reports and are rarely quantified per product and market. Moreover, the scope of calculations often differs among companies rendering existing carbon footprint information incomparable.
This release goes beyond providing consumers with climate transparency”, adds David Bryngelsson. “Our ambition is that the release of the carbon footprint information will mobilize the food and beverage industry to look beyond their sustainability reports and calculation methodologies. The food industry has digital tools to dynamically enter the market of climate transparent food and grab a share.”
The carbon footprints are searchable by name and openly accessible at apps.carboncloud.com/climatehub. Each product page includes a carbon footprint calculated in lb of CO2e per lb of product, a breakdown of emissions per supply chain stage and an attributional life cycle assessment. CarbonCloud is set to expand the digital library of carbon footprints with food and beverage products at store shelves globally, following with the UK.
Related Posts
CarbonClouds beräkningar i ny våg av kokböcker
I mitten av september släpptes Köttälskarens nästan vegetariska kokbok av Eva och Matts Hildén. Det var den tredje kokboken sedan i juli som beräknat och visar receptens och matens faktisk
CarbonCloud raises €7.5 million in Series A to become the food industry’s leading climate intelligence platform
CarbonCloud, the climate-tech SaaS solution for the food industry secured €7.5 million to expand their market position as the leading climate intelligence platform. The financing round was led by Cu
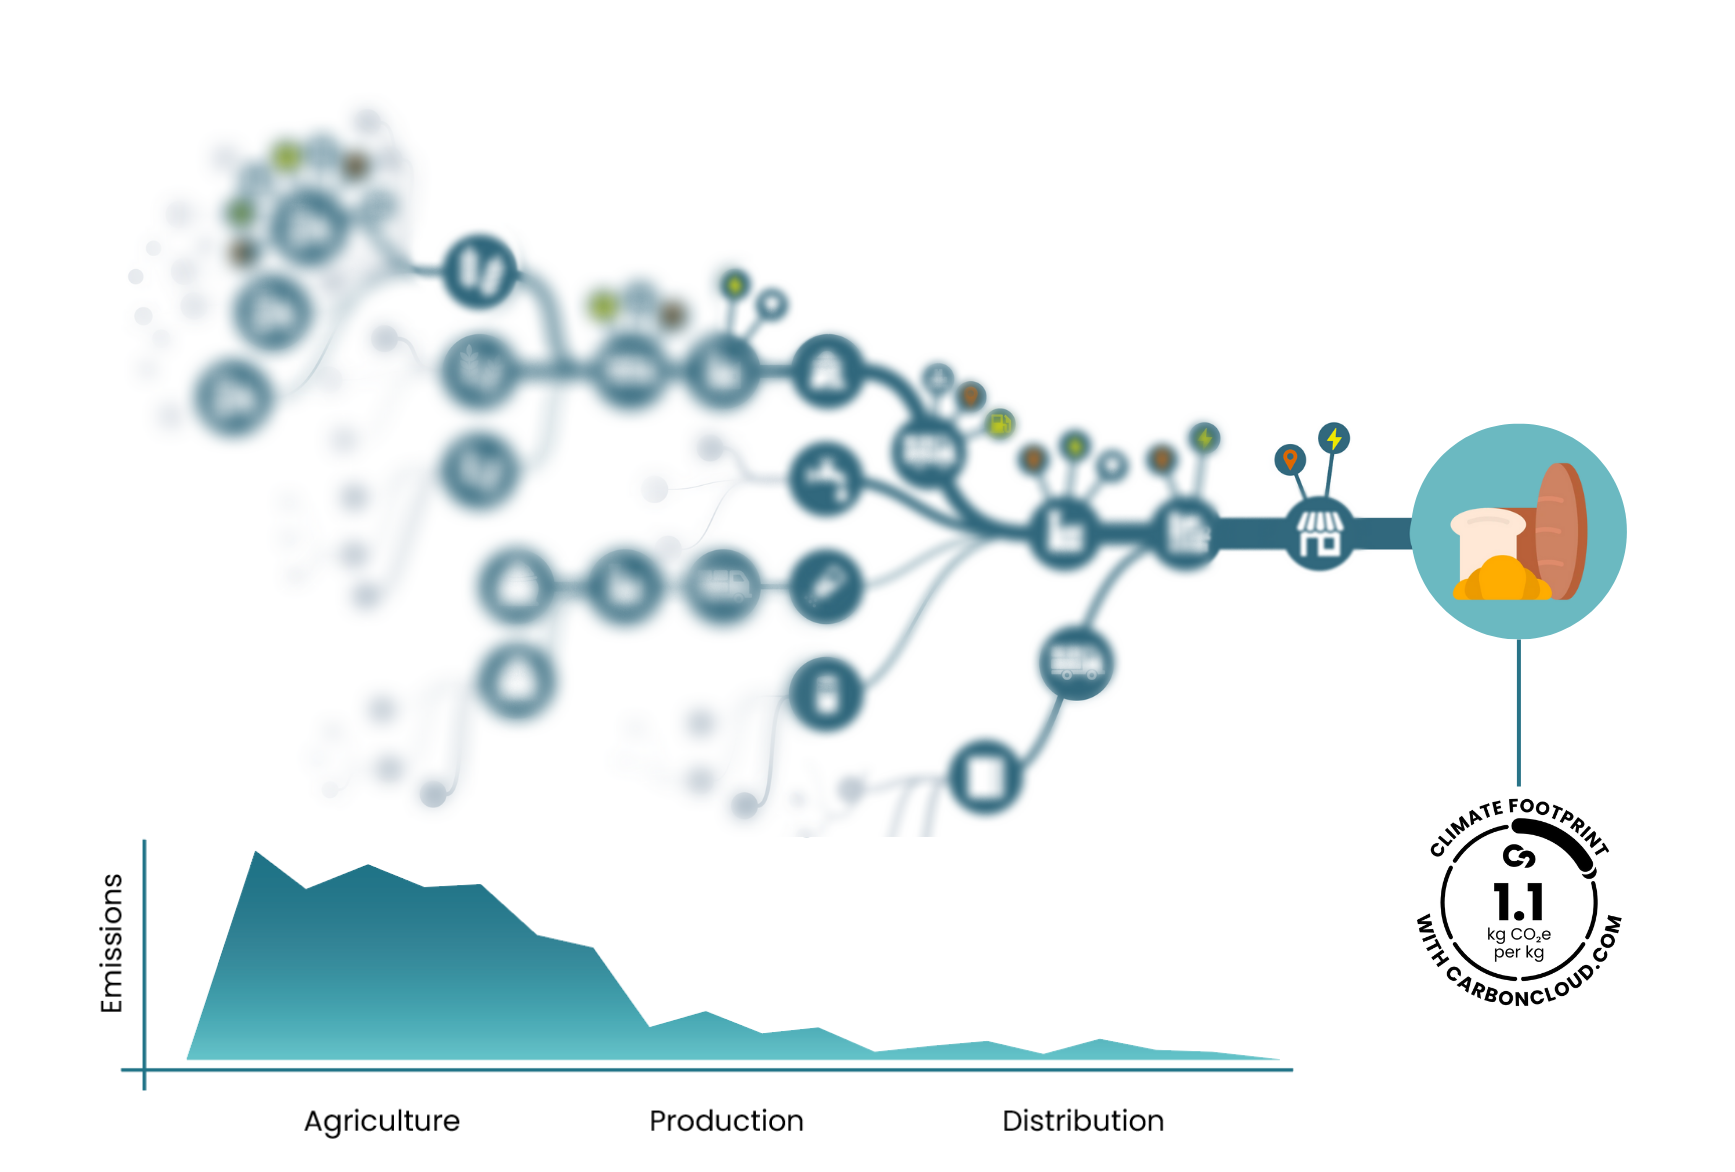
Climate transparency in food supply chains: The biggest need since sliced bread?
For a third year in 2022, climate action failure takes the top spot as the highest- concerning risk in the World Economic Forum’s Global Risk Report [1]. Contributing a third of the global emissions
Why is comparability important in carbon footprints?
Comparing different climate footprints may seem nitty-gritty, sustainability navel-gazing. In actuality, the comparability of climate footprints is central to what humanity can do against climate chan