6.2
kg CO₂e

CALCULATE YOUR BASELINE

Build upon a solid baseline and automate your emissions map

Speed up your net zero roadmap with product emissions insights you can do something with – from beginning to end of your supply chain.

AUTOMATED SUPPLY CHAIN MAPPING

Thousands of climate footprints in weeks

Your emissions mapped, quicker than ever

It’s 2024. You can’t do manual LCAs every year for hundreds or thousands of products.
(Yes, spreadsheets are manual LCAs.)

Fast, automated, and always updated is what Automated Modeling is for.

  • Calculate your emissions baseline automatically, in days, with minimal input.
  • Spend your time meaningfully. Refine the digital twins of your products and increase accuracy instead of endless “input”.
  • Always comparable, always in full scope, always up-to-date. By definition, software does that for you.
Is the Automated Modeling engine credible?

CarbonCloud is a combination of a climate calculator (LCA tool), a supply chain management system, and a database. Every product assessed and published on the platform is available on the platform as an ingredient for other production processes. Everything with market-leading consistency and detail.

At the foundation is the agricultural engine (based on 2019 IPCC guidelines) that calculates the climate performance for agricultural products at farm gate. It comes pre-populated with production system data for close to every commercially grown crop from every country in the world where it is grown. They are all consistently calculated based on the best available data for yields, fertilization, soil types, climate zones, etc.
On top of this, there are thousands of modules for refinement processes and semi-refined products, fuel types, country-specific electricity, and a vast dataset of benchmark products at store shelf.

The data counts in the tens of thousands and is rapidly growing, as CarbonCloud continuously develop the dataset and increase its resolution, and via increasing numbers of farmers, B2B producers and B2c producers joining the platform. All this data is available for users of the platform and a large share of the data is openly available at ClimateHub.

Each footprint is based on input data from high-quality sources. The data available on the CarbonCloud platform mainly derives from three origins:

  • Statistics and data from national and international agencies for example the Food and Agriculture Organization of United Nations or the National Inventory of Submissions of the UNFCCC.
  • Relevant scientific literature: if the process ingredients are modeled, we utilize extensive scientific literature which our in-house science team reviews and adapts accordingly.
  • User input: the platform learns as users feed production system data into it.

Our calculations and methodology are compatible with ISO 14067 and GHG protocol Product Life Cycle Accounting and Reporting Standard, which are the current standards for LCA studies.

What data do you require to get started with Automated Modeling?

As a starting point to do the initial mapping of your product portfolio, we would ask for the following information on your products:
– Product name
– Bill of Material
– Production location, at least country
– Market where the products are sold
– Packaging material(s)

There is a long list of information that will increase resolution and accuracy, but a relatively short list will do most of the work. 

CarbonCloud never asks for GHG emissions for any process. For consistency, all emissions are calculated by the platform. All questions relate to production processes with a focus on readily available information to the producers and suppliers. You don’t need to dive deep into the science or methodology to get the climate footprints of your portfolio. You instantly get the richness of immediate insights while feeding in the data and working on the platform. Everyone quickly becomes a climate expert on their part of the business.

What happens after my company provides the data?

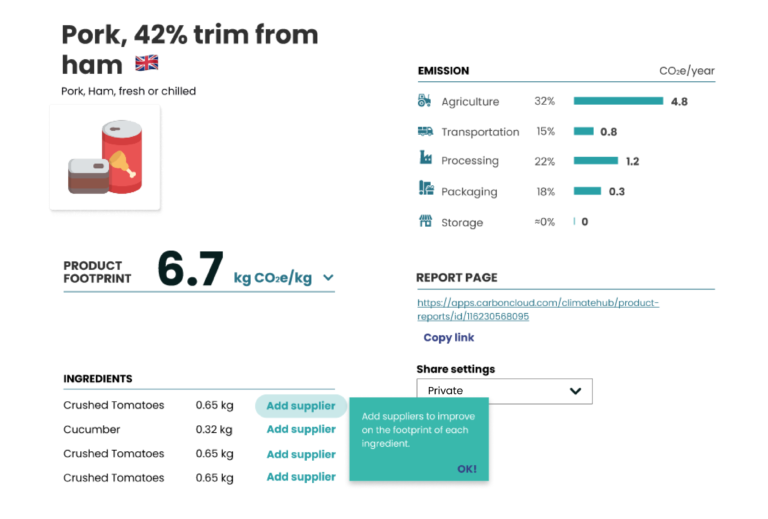
CarbonCloud runs your data through a machine learning algorithm, together with the platform’s library of ingredients, production processes, transport modules, etc., to map out representative supply chains for every ingredient and product. At this stage, your company gets complete and consistent scope 1+2+3 mapping for your portfolio, accompanied by a breakdown per product and per stage in the value chain.

Granularity and precision depend on the amount of information available at the time of the mapping. The insights from Automated mapping will guide the users of the platform as to how best to proceed: Which additional data to collect to increase resolution where it matters the most, which products to focus efforts on, and which suppliers to engage for the highest ROI relating to actionable insights and data.

Carbon footprint for food products
Engage food suppliers with emissions data

Go top-down with data collection and get the full picture quicker

Guess what. The hard way is not necessarily the best way. You don’t need to gather all your data before you start calculating your climate footprints – You can start with what you know and optimize right after.

  • Map your product emissions for Scopes 1, 2, 3 from first principle.
  • Refine the digital twin with deviations from average production and increase the accuracy.
  • Transition smoothly from default values to primary data from your and your suppliers’ operations.

From my initial phone call, I knew that CarbonCloud was the right partner for us. They are as fast-moving as we are and understand the importance of our mission. They were supportive every step of the way, from helping us identify the data we needed to teaching us how to use the modelling platform.

Emily Gander
Head of Comms & Sustainability at TENZING Natural Energy

(noun)

1: The most accurate engine for quick, automated modeling of greenhouse gas emissions for large food portfolios and supply chains.

2: The replacement of manual life cycle assessment.

3: The complete and automated emissions map of a food product portfolio

Compare apples and oranges​

Our methodology is synthesized to serve two simple but critical reasons: Comparability and future-proofing.

  • Access the latest sustainability developments at all times as our calculations evolve to account for new research, regulations, and emerging standards. 
  • Your climate footprint database and modeling are based on scientific best practices, and official international reports, and on the same basis.
  • All data points, from farm to store shelf, are calculated within the same system boundaries, making all footprints harmonized, consistent, and comparable across all parameters.

Is this legit?

Curious to know more about our methodology? Dive in.

Compare carbon footprints of food products

HOW IT WORKS

Let computers do what they do best

Leave the calculating to the engine made for the job and focus on what you do best – strategize and act on insights.
1.
Input: The data you work with on a daily

No need to go hunting for data. Simply list the portfolio data you already know by heart – product name, ingredients, country of origin, GTIN number – and Automated Modeling will do the rest.

2.
Processing: Automated emissions modeling

Automated Modeling's Natural Language Processing engine scans your data input and runs it through CarbonCloud's advanced climate footprint dataset. The engine programmatically matches each product to its supply chain model and calculates its climate footprint at store shelf.

3.
Insights: Full emissions profile of your portfolio

Gain instant intelligence, identify hotspots, set quantitative targets, increase data definition, and start the reduction work!

READY FOR THE NEXT STEP?

Drive impactful reduction initiatives

Take reduction initiatives with a real impact and manage your climate footprint from farm to shelf.

This shan't take long...

Ready to meet your portfolio emissions? Let us automate it

Getting started is hard – Simplify it with Automated Modeling and jump straight to the action. Reach out to our climate performance experts and see how you can jumpstart your climate strategy.